Host Overview Panel
A Grafana panel plugin for visualizing the status of fleets of resources — servers, database instances, containers, or any entity with a status field and optional metrics.
Features
- Modern design for Grafana 12 — the panel uses built-in theme-ready components.
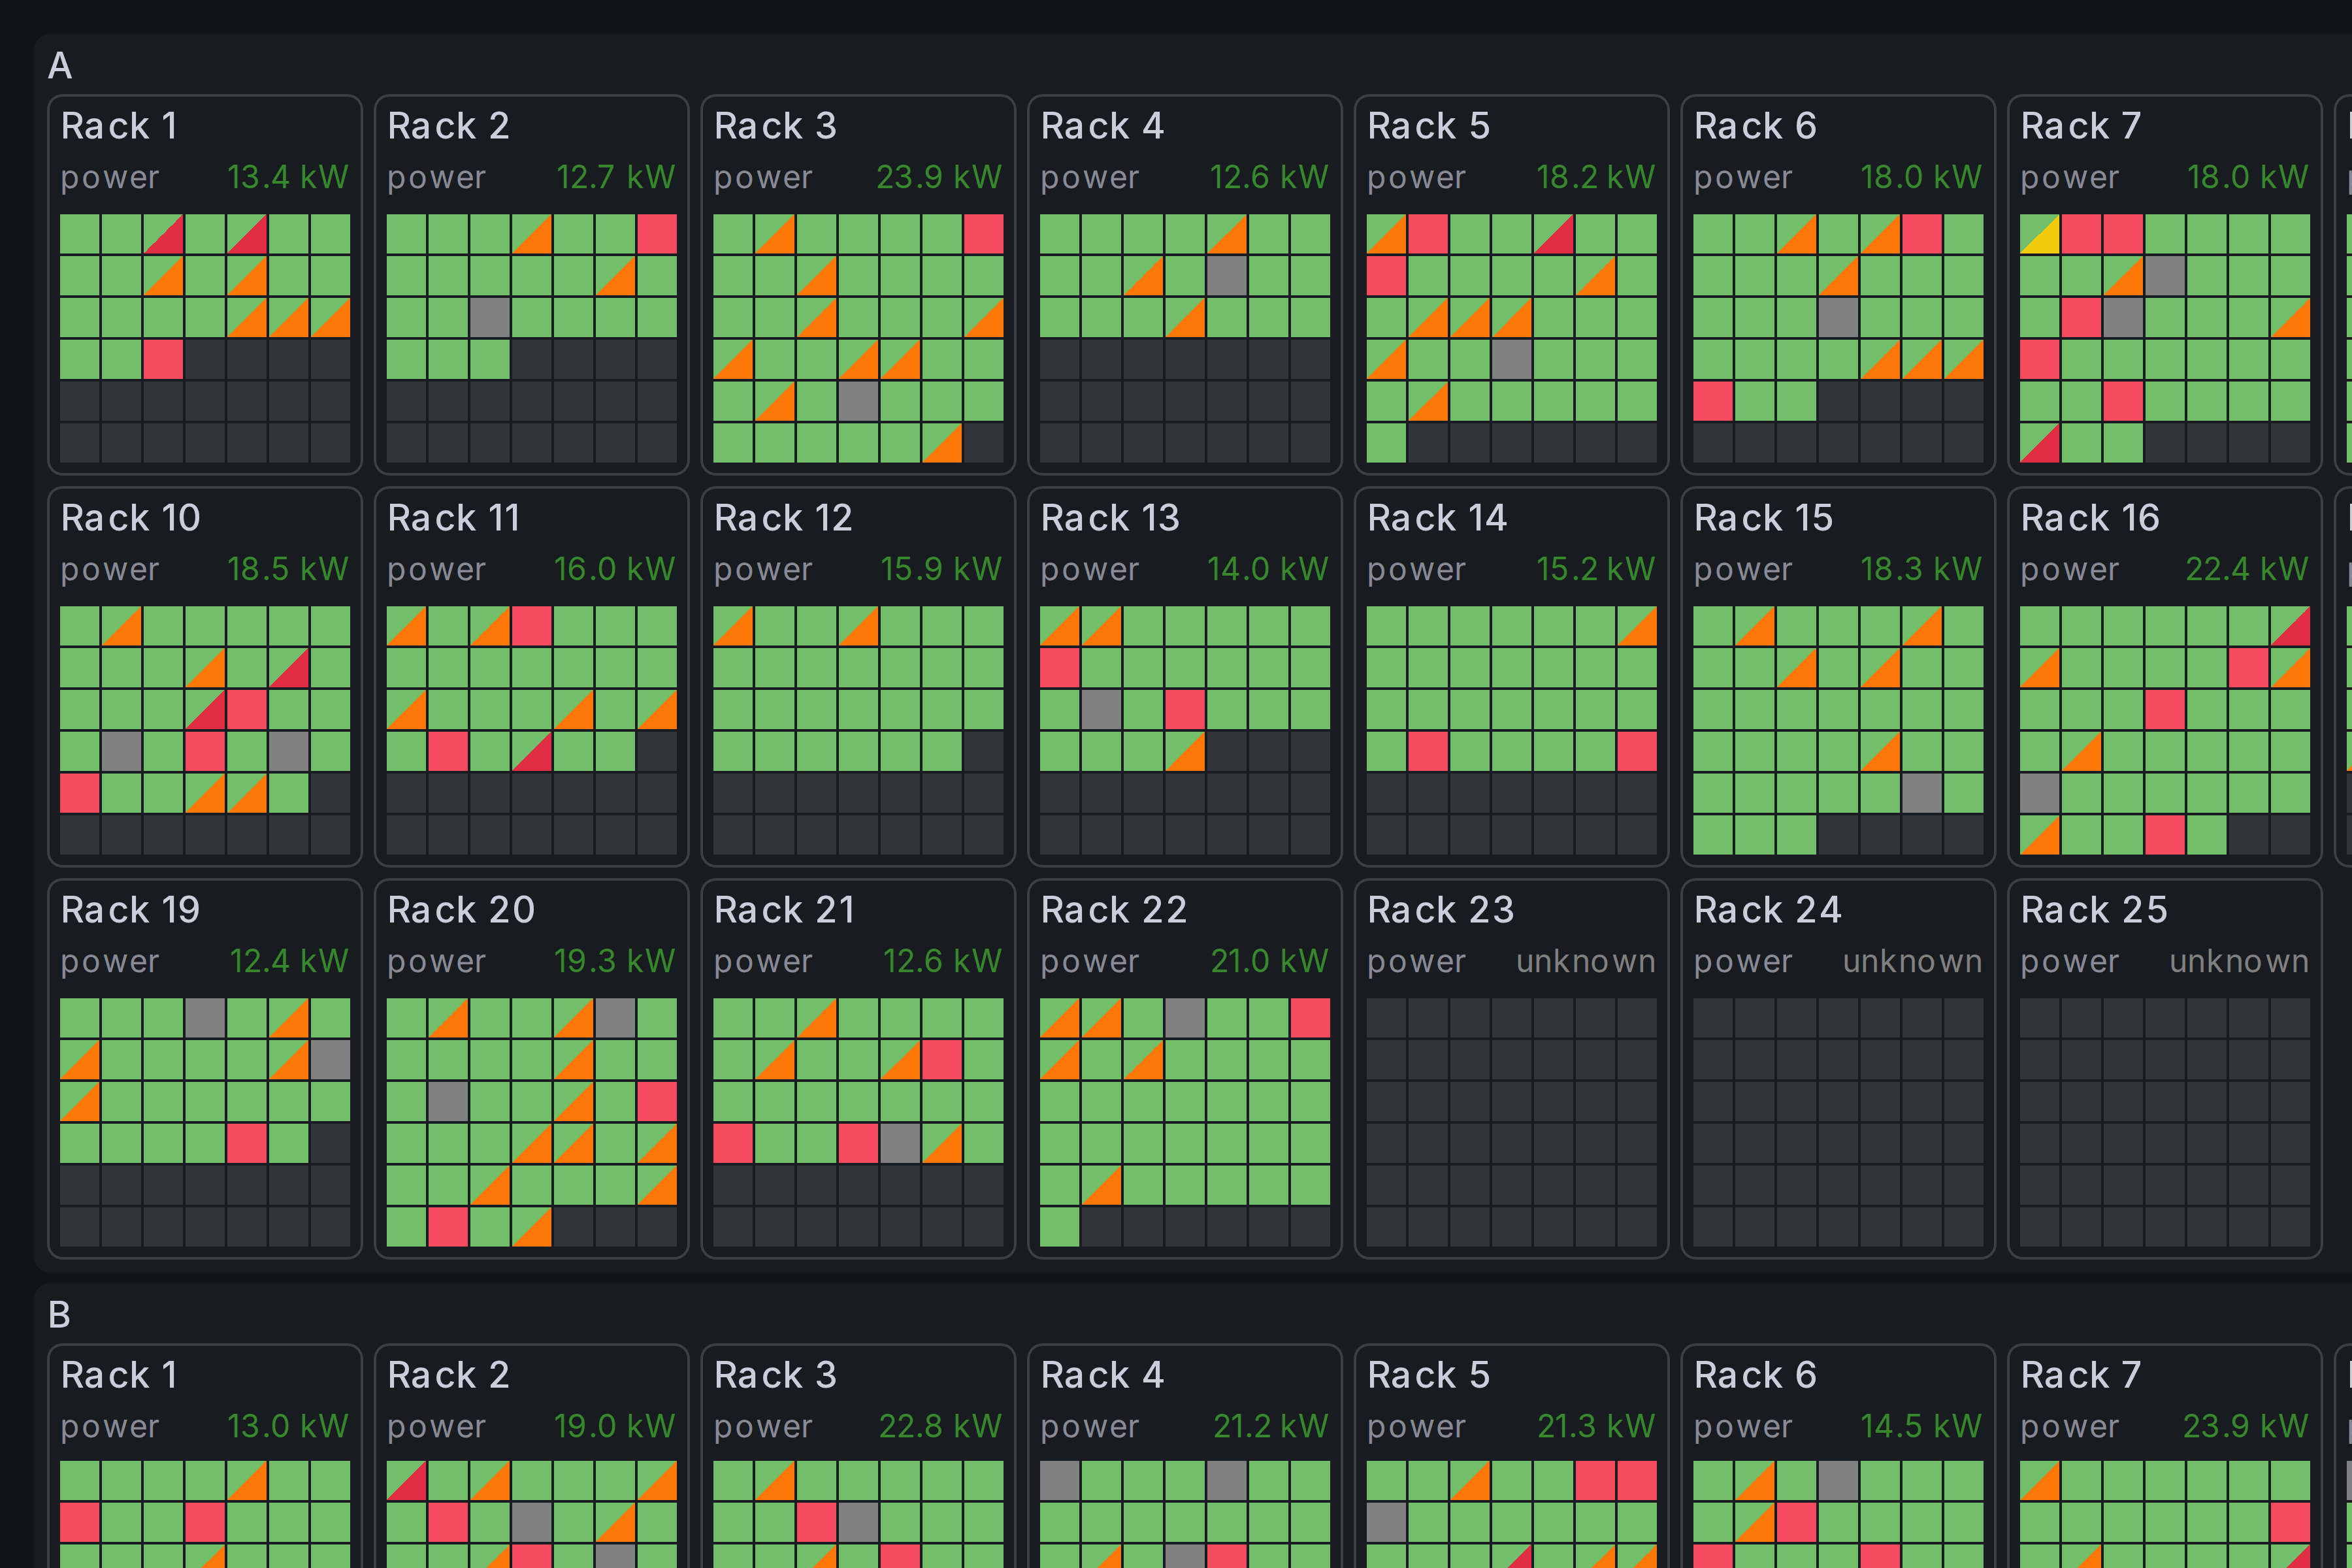
- Flexible grouping — nest resources by any combination of fields, with configurable sort order, coloring, and layout.
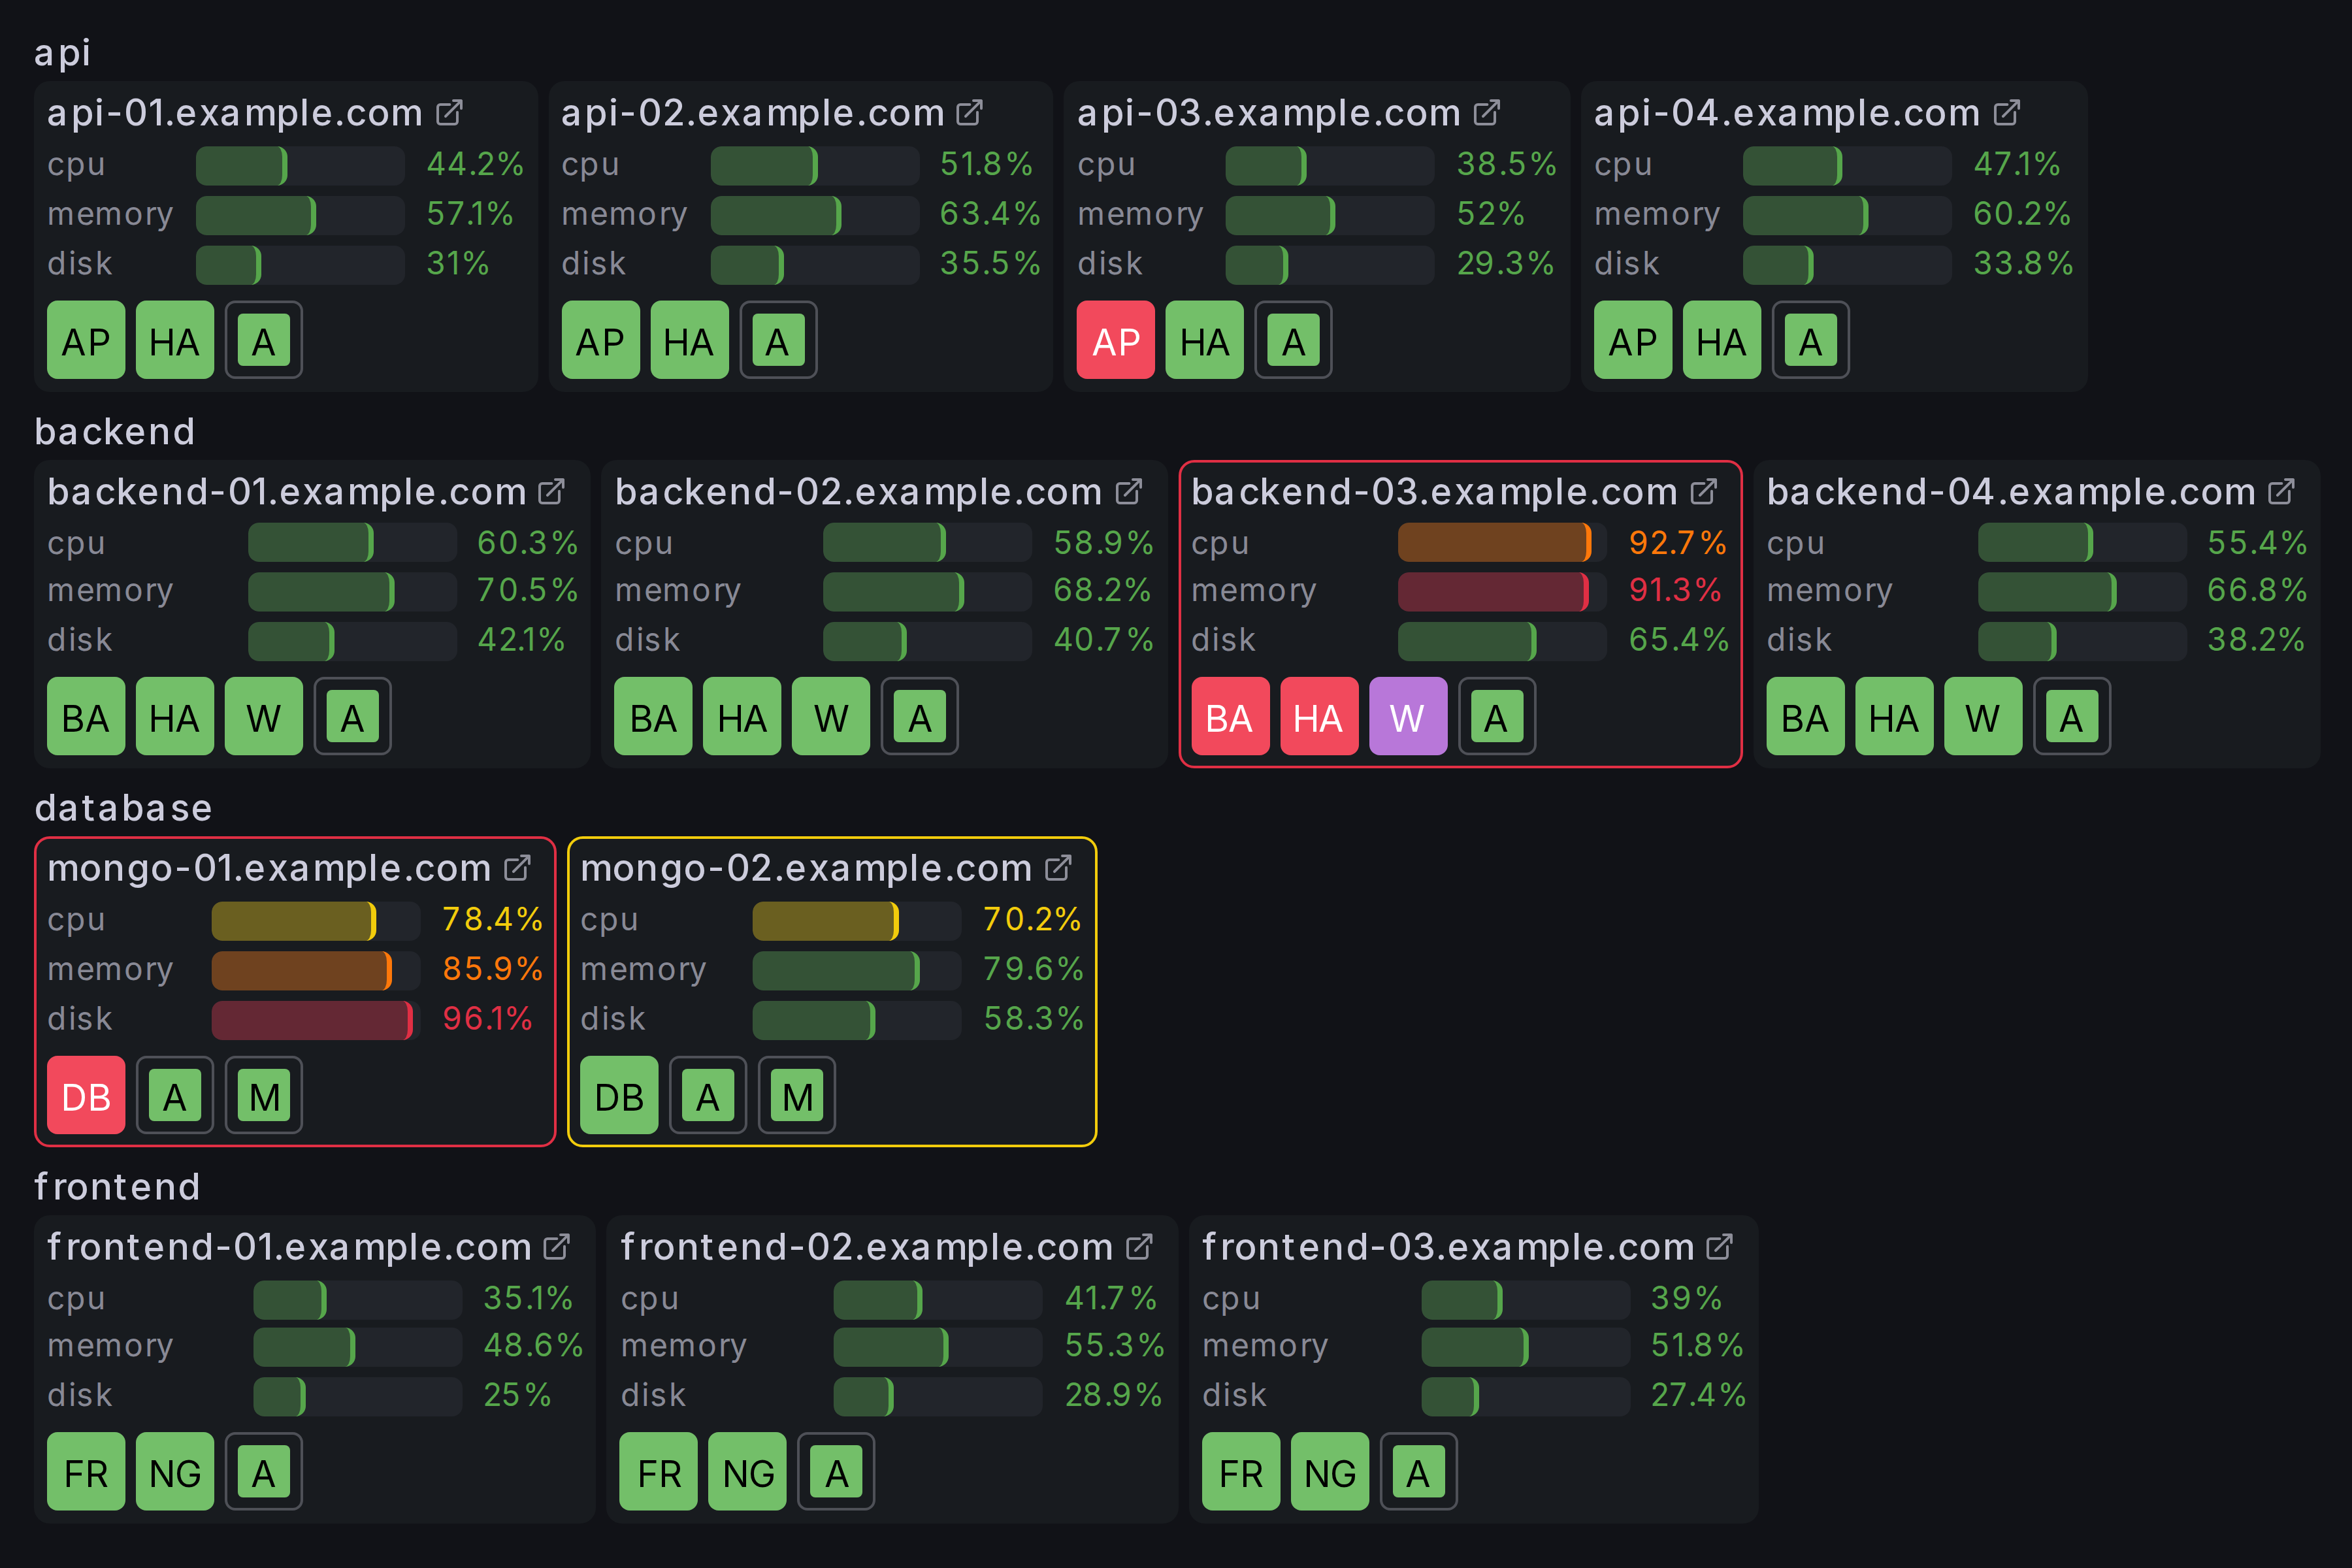
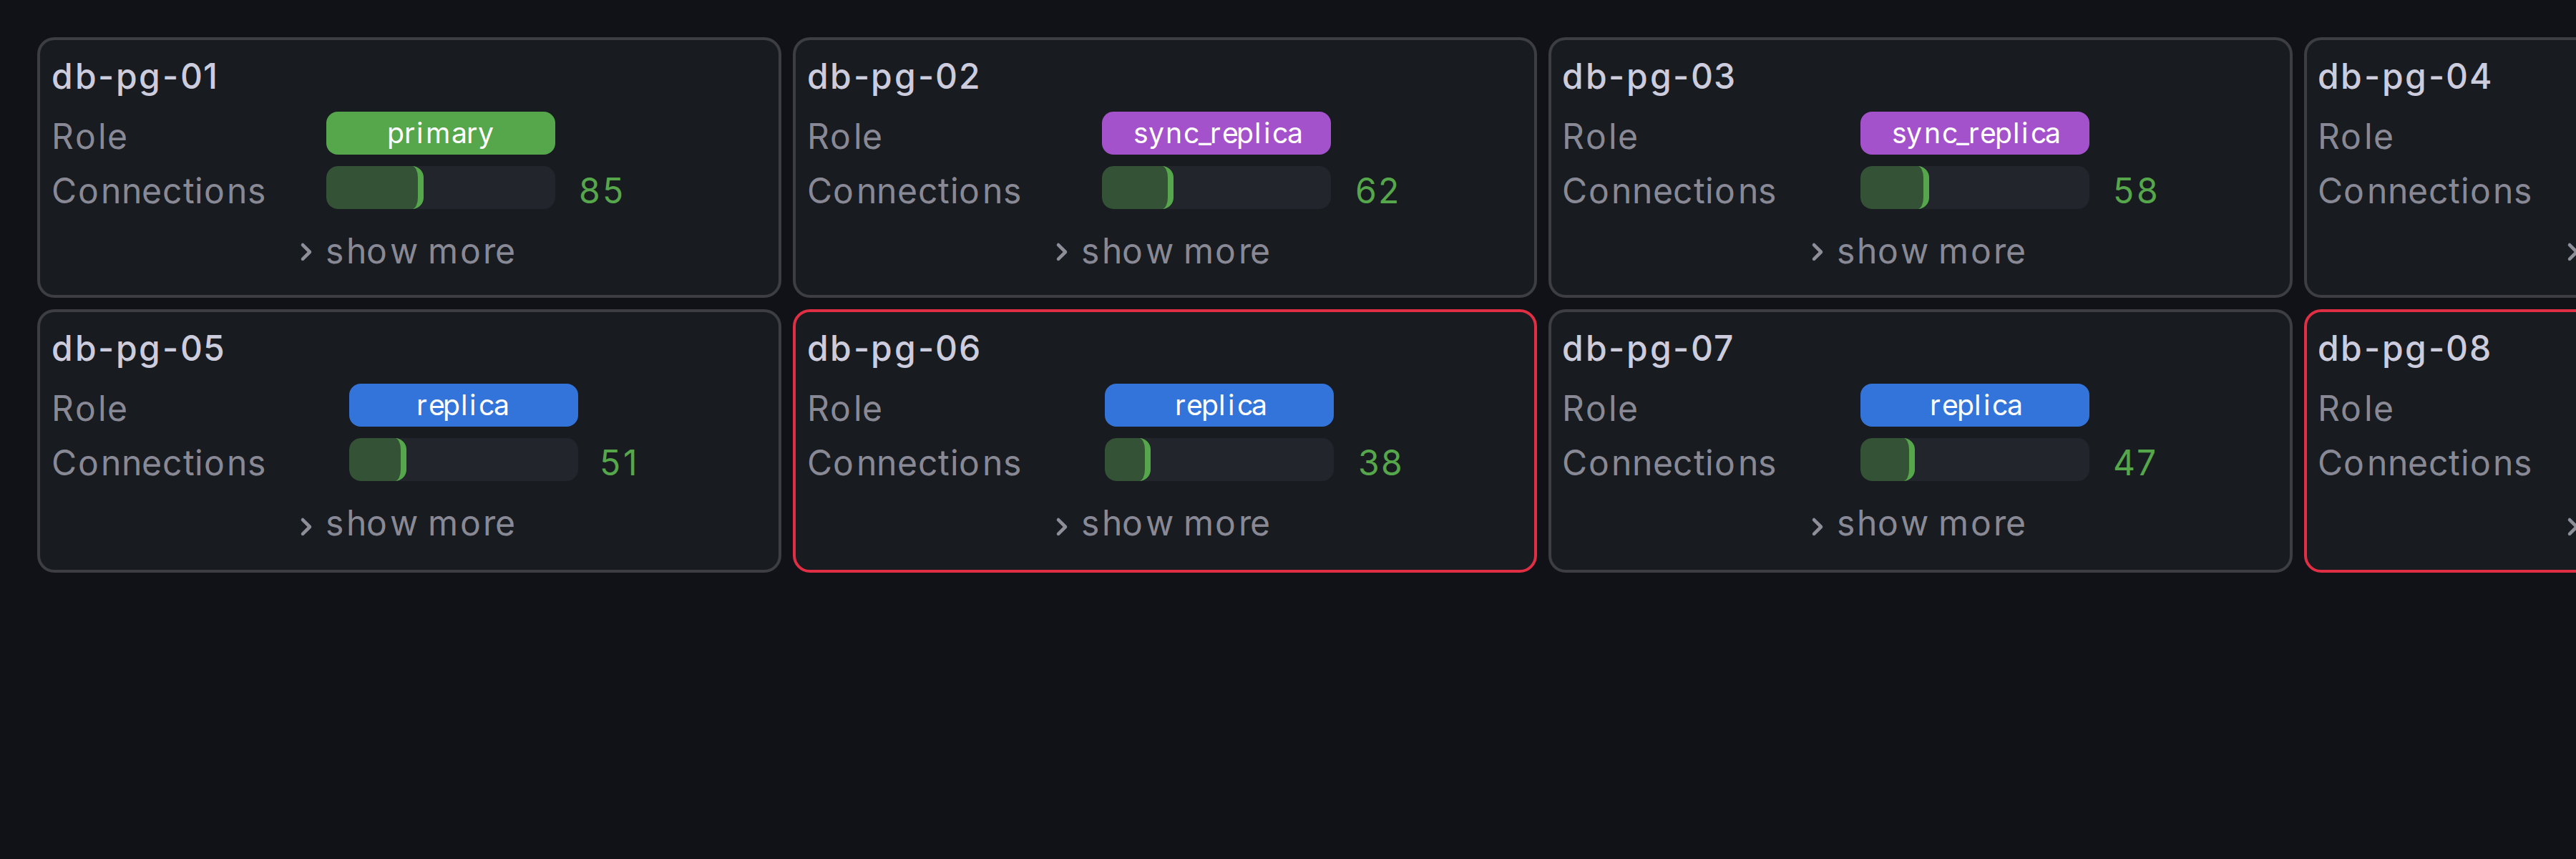
- Multiple display modes — simple colored cells, cells with text labels, or rich table cards showing multiple fields per resource.
- Joins — attach metrics from other data frames to groups or individual resources via key-based joins.
- Field visualizations — text, colored text, colored background, gauges, and sparklines for joined or inline fields.
- Color overrides — fields and joins can override cell or group border colors based on threshold severity.
- Data links support — define data links for any group, resource, or metric.
- Tooltips — hoverable tooltips with configurable title, fields, and joined data.
Requirements
- Grafana 12.0 or later.