Data format
Host Overview Panel expects data in long format: a table where each row represents one resource, with columns for its identity, status, grouping keys, and any additional metrics.
Required columns
At minimum, the panel needs:
- A status field — used to color each resource cell (e.g.
up,status,state).
The following columns are optional but commonly used:
- An ID field — uniquely identifies each resource. Used for sorting, detecting missing data (known IDs), and labeling cells.
- One or more grouping fields — used to nest resources into hierarchical groups
(e.g.
host,datacenter,rack).
Any other columns in the data frame can be displayed as metrics in tooltips, rich table cards, or group headers.
Query settings
Two query settings affect the shape of the data the panel receives: type and format.
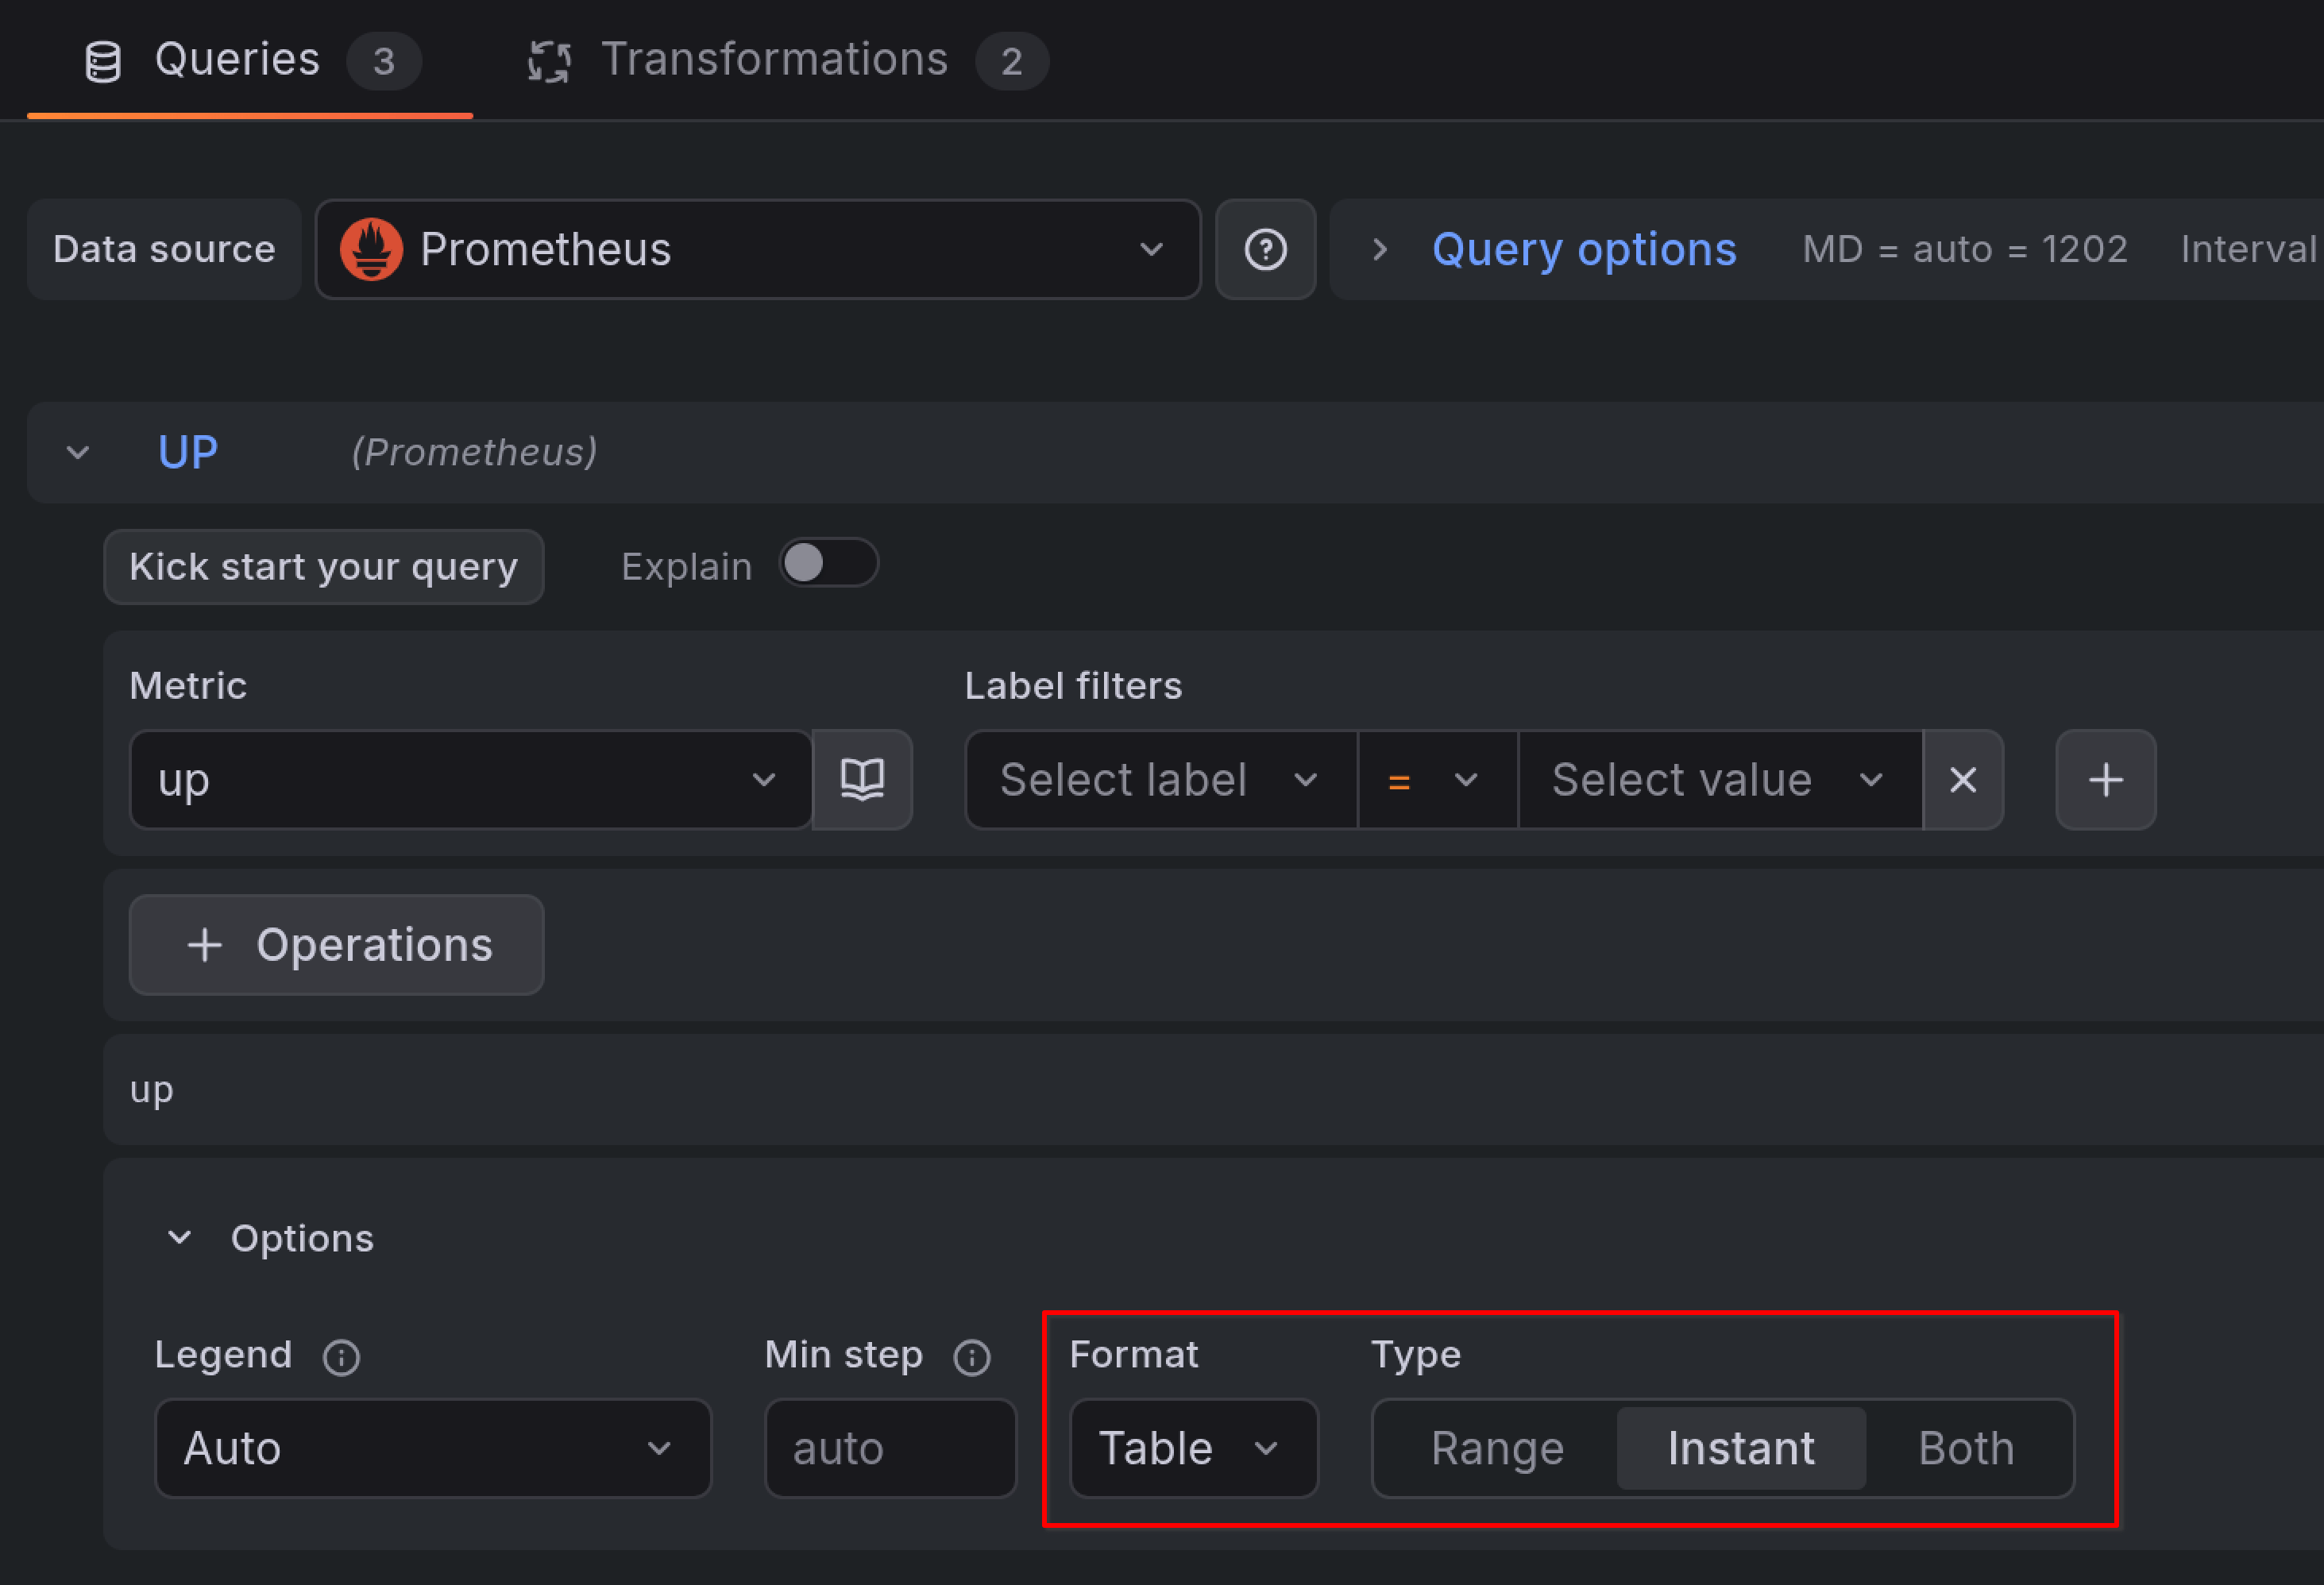
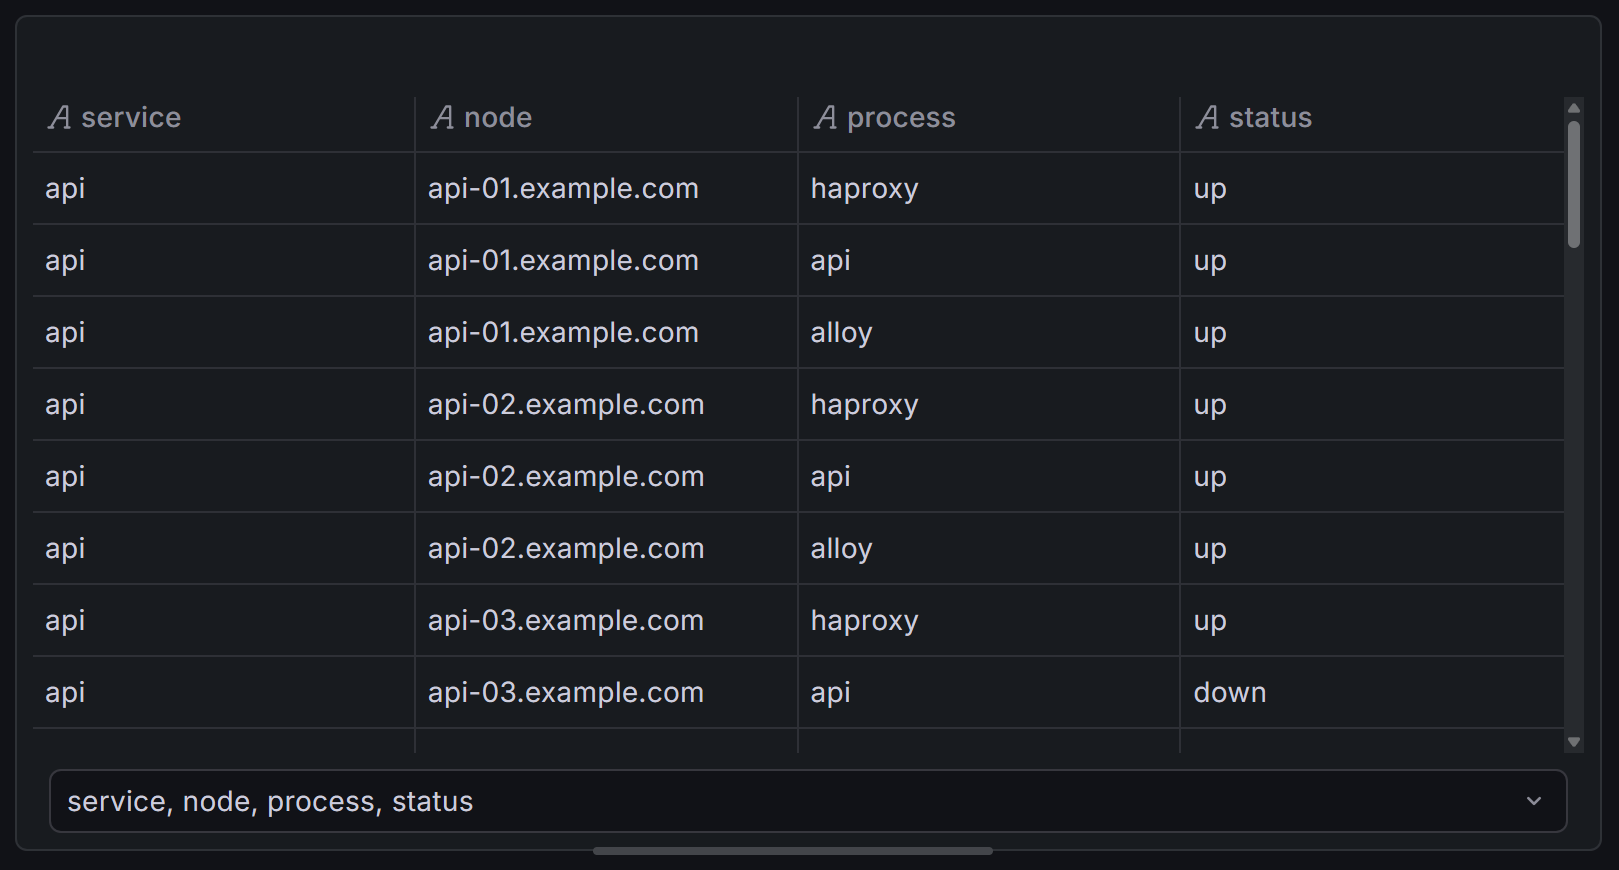
Instant queries with Table format (simplest)
Set the query type to Instant and format to Table. This produces a flat table with one row per series and labels as columns — exactly the long format the panel expects, with no transformations needed.
Use this combination when you only need the current resource status and plan to display values as text, colored cells, or gauges.
Range queries with Time series format (for sparklines)
Set the query type to Range and keep the default Time series format. This returns full time series over the dashboard time range, which you can turn into sparklines.
Range queries require transformations to convert the data into the table format
the panel expects. The Time series to table transformation
produces a Trend column containing the embedded time series suitable for
sparkline rendering.
Note
Range queries with Table format produce one row per timestamp, not one row per series. This is not useful for the Host Overview Panel. Use Time series format with transformations instead.
Multiple data frames
When your panel has multiple queries, each query produces a separate data frame. The panel visualizes one primary data frame — selected via the Data frame option at the top of the panel settings. When left empty, the first frame is used.
Additional data frames are not displayed directly. Instead, they can be attached to groups or resources through joins, allowing you to pull in metrics, status values, or known IDs from secondary queries.