Basic setup
In this section we'll create a Host Overview panel that shows the status of all docker containers, grouped by host.
Step 1: Create the panel
Create a new panel and select Host Overview as the visualization type.
Step 2: Add a query
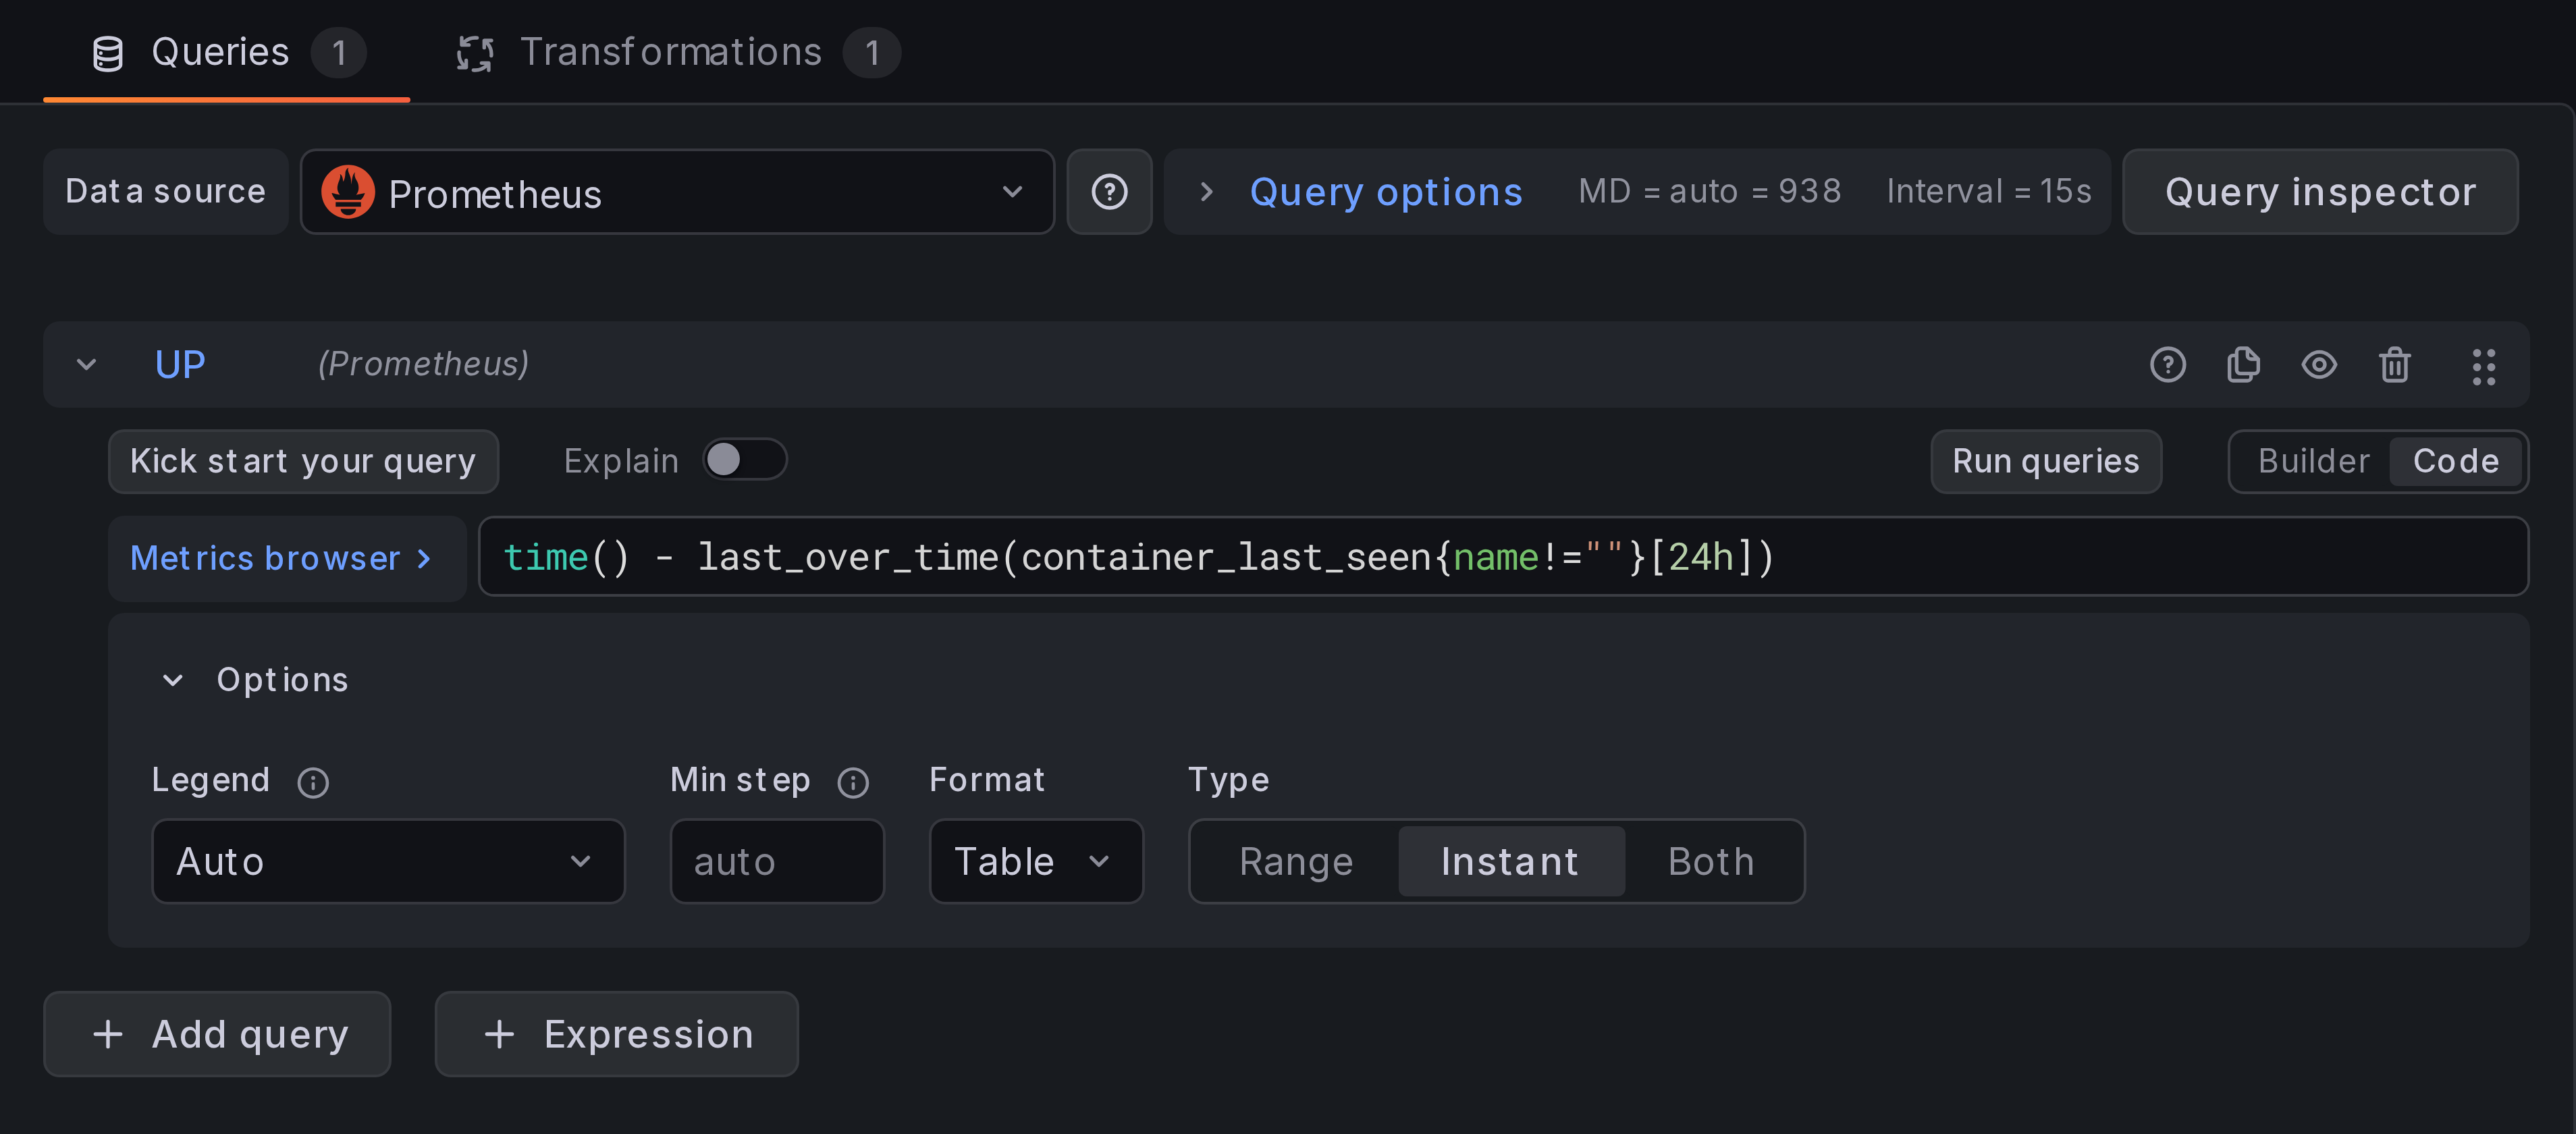
Select your Prometheus data source and add a query for the container_last_seen
metric:
time() - last_over_time(container_last_seen{name!=""}[24h])
Set the query type to Instant and the format to Table.
Step 3: Add data transformations
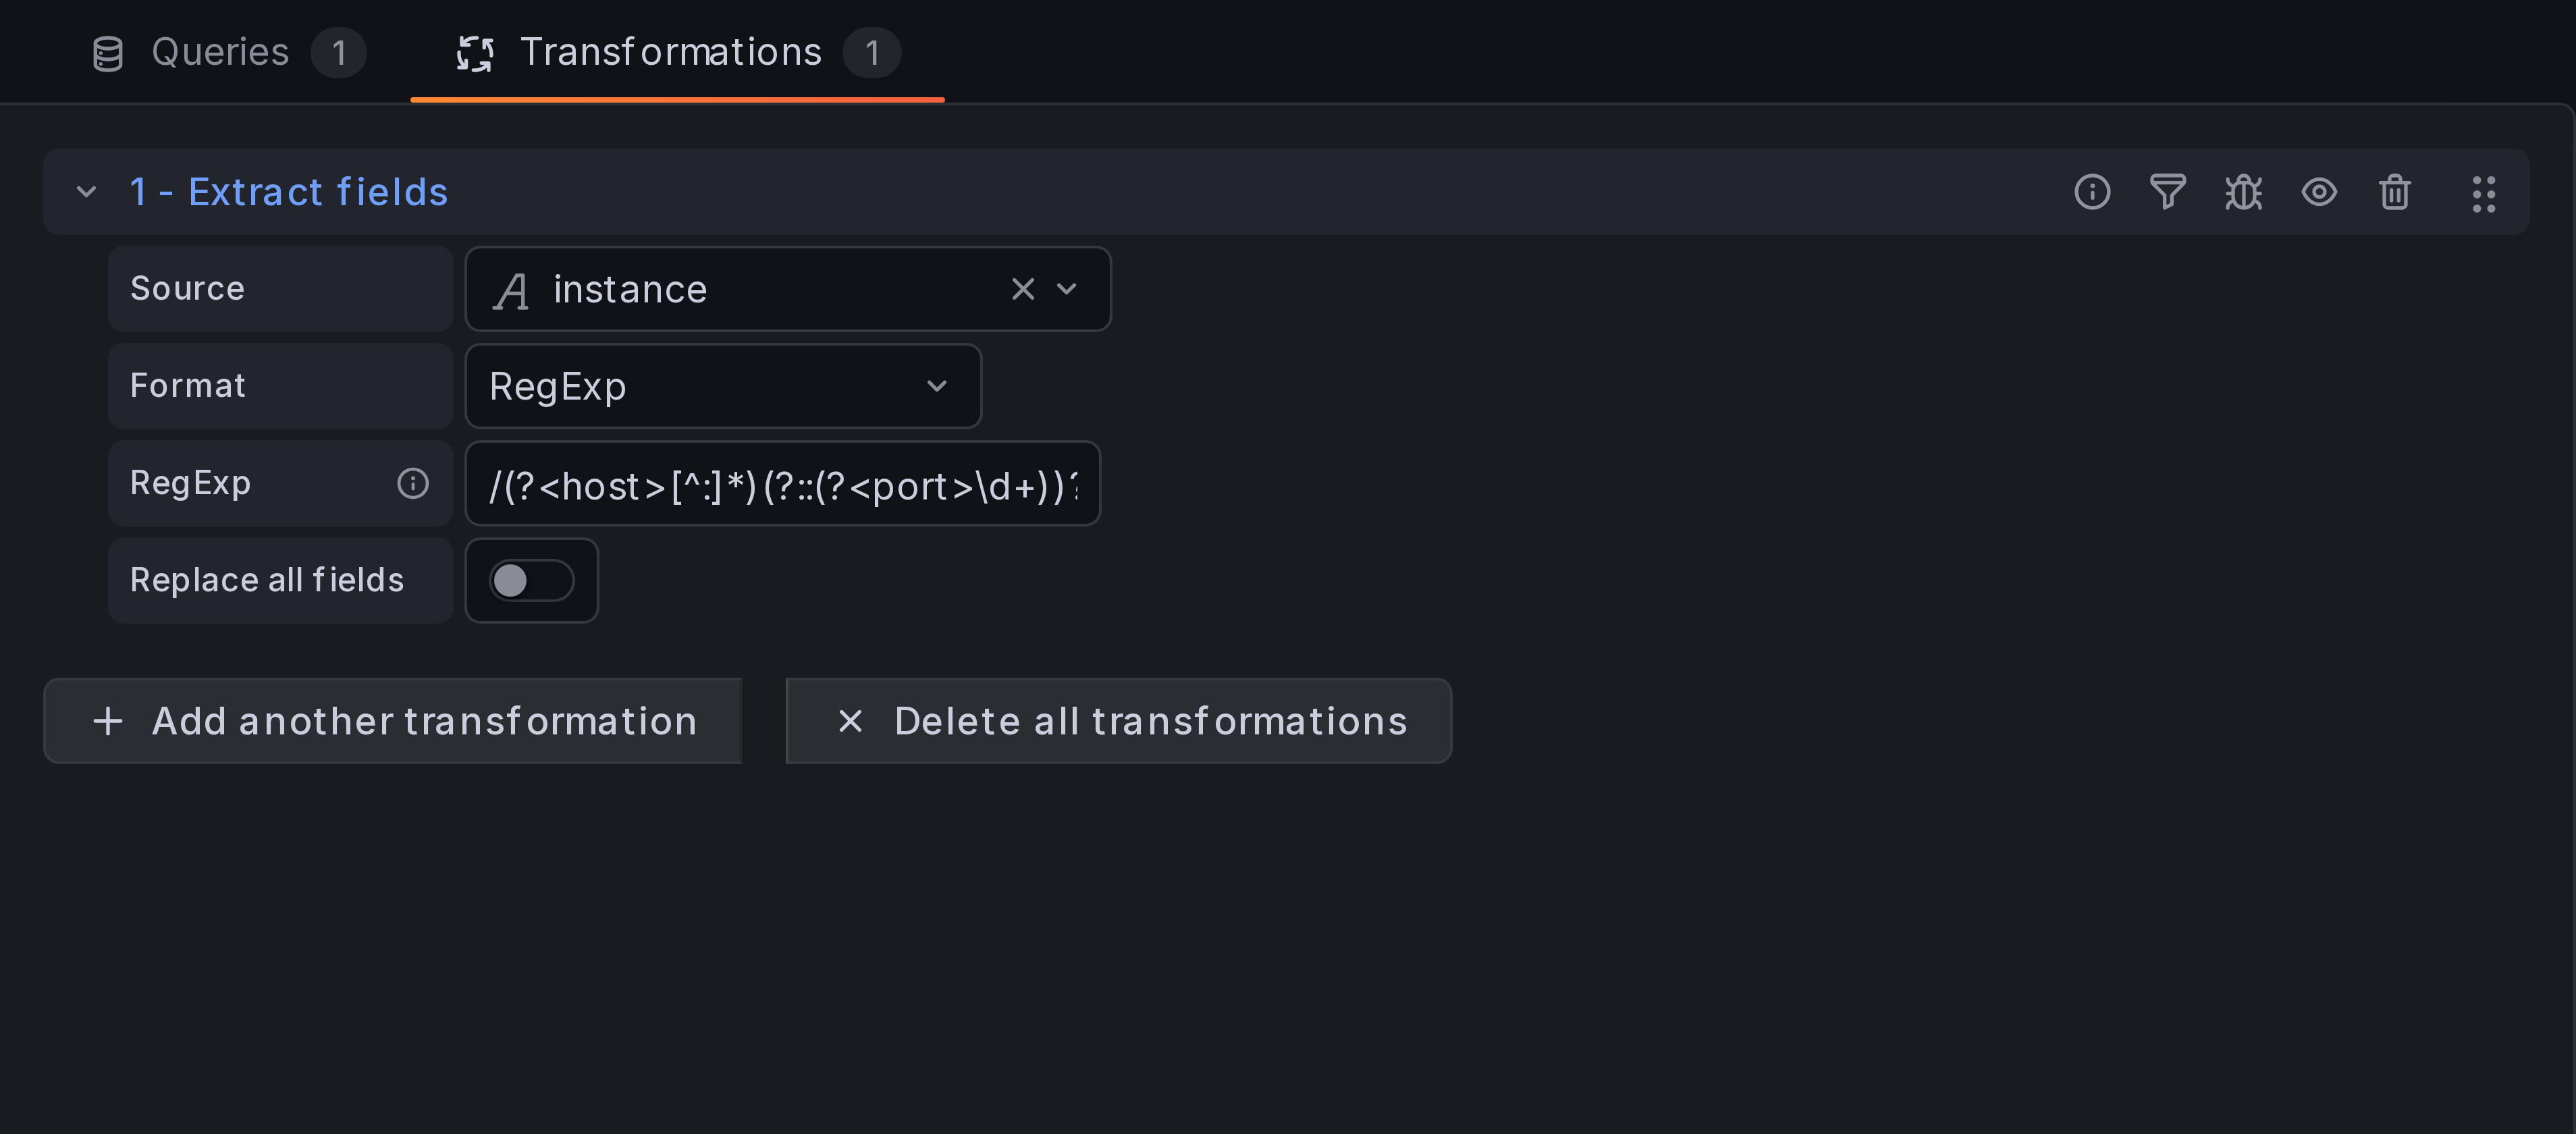
By default, Prometheus exports label instance that contains host and port.
We need to split it: add Extract fields transformation,
set the source to instance, format to RegExp, and use the pattern:
/(?<host>[^:]*)(?::(?<port>\d+))?/
Step 4: Add grouping
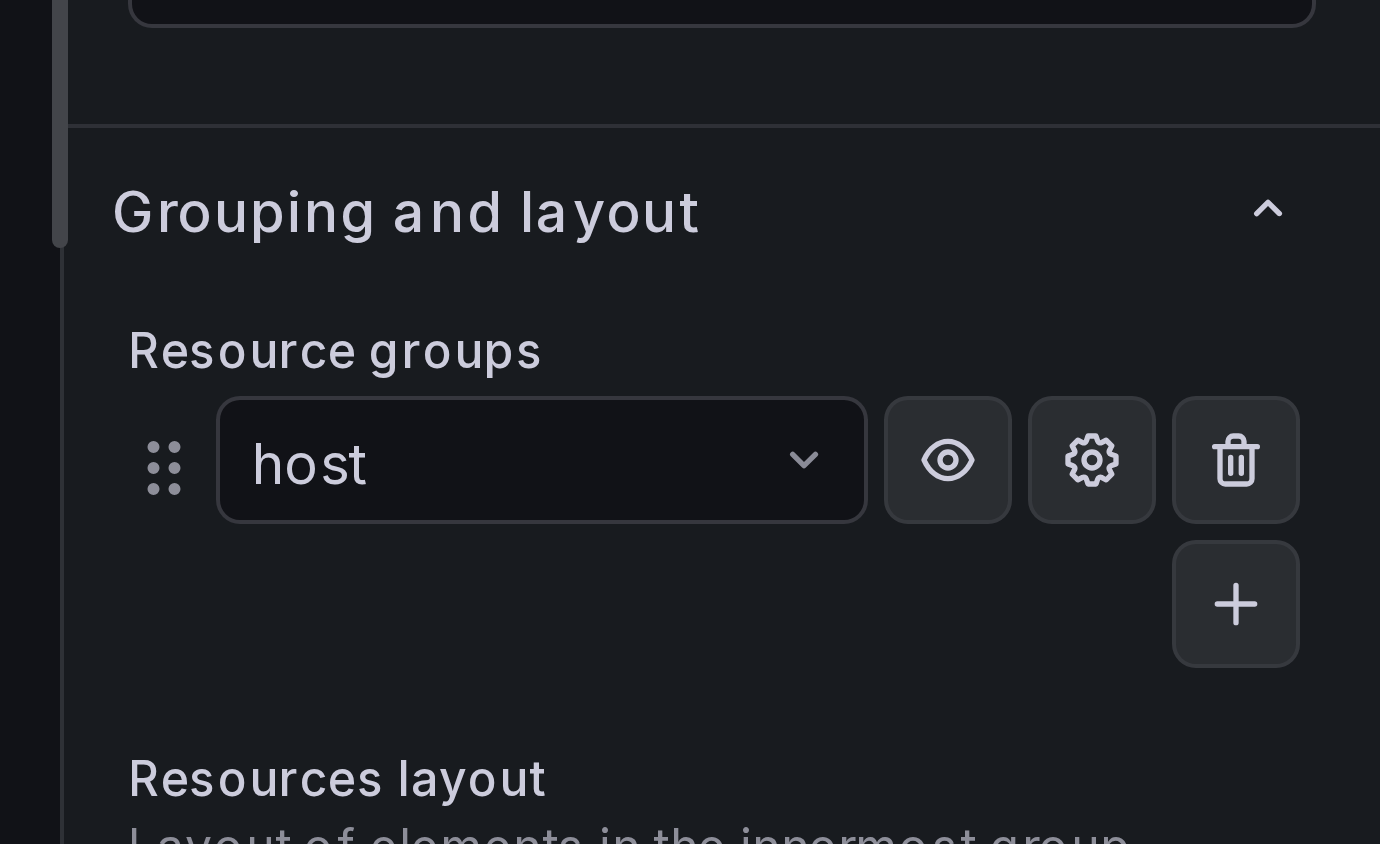
In the panel settings sidebar, find Grouping and layout
and click Add new grouping rule. Select group key host.
This nests resources under their host, so each host gets its own labeled box.
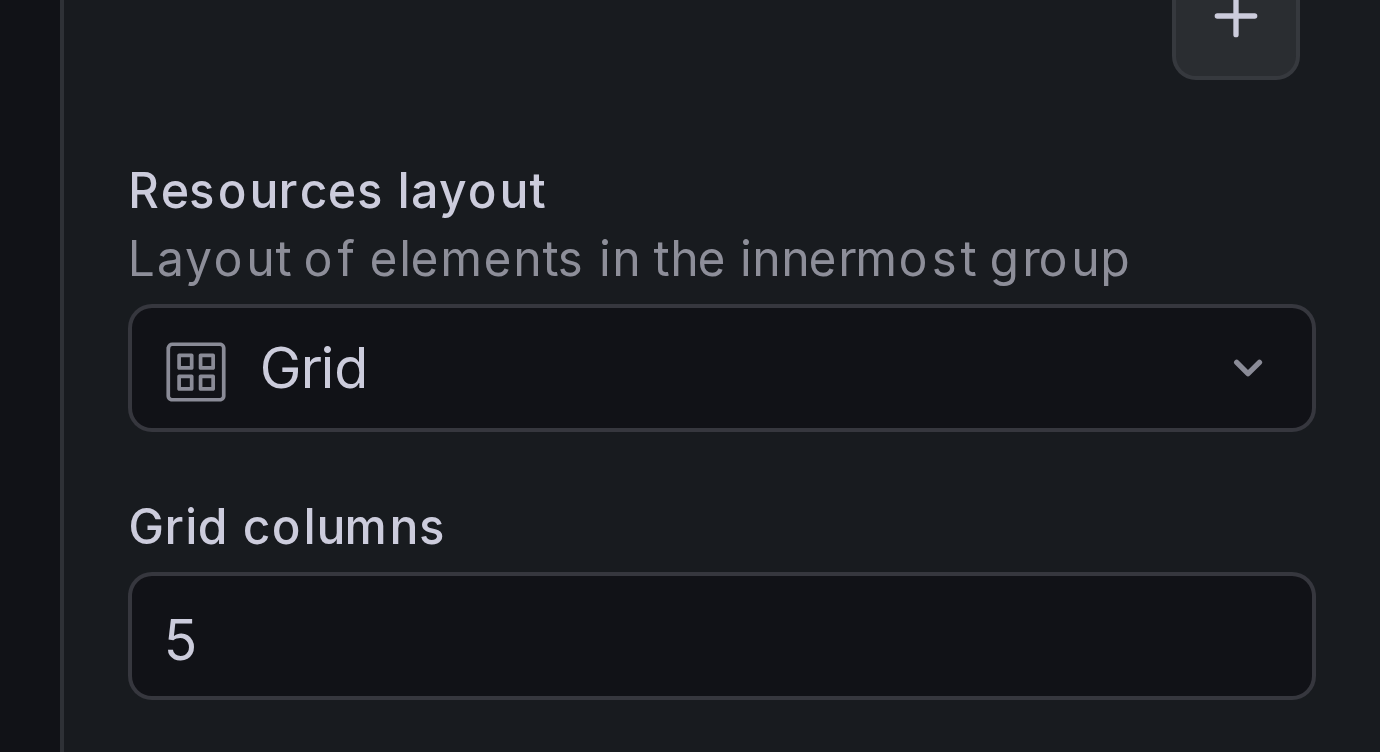
Step 5: Set up layout
Under Grouping and layout > Resources layout, select Grid.
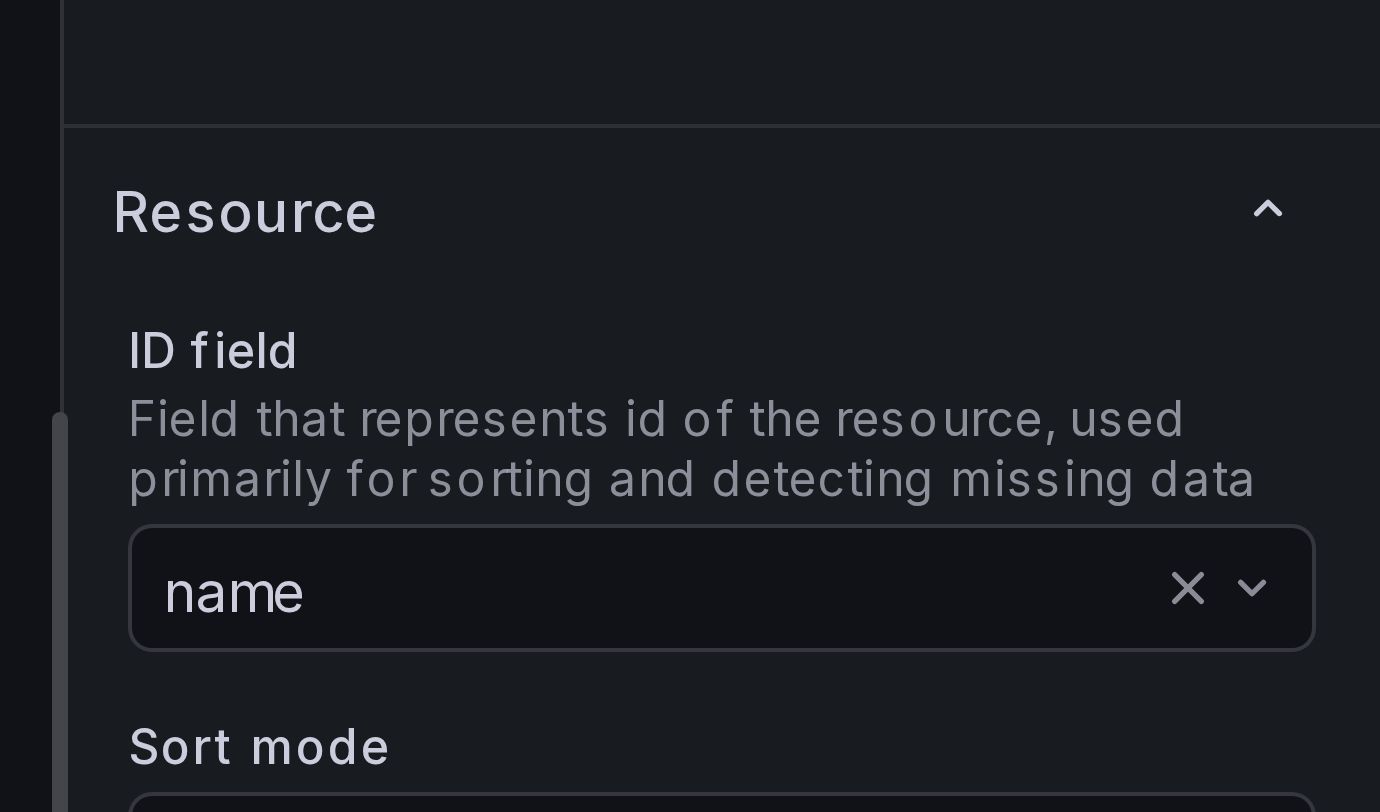
Step 6: Set the resource ID field
Under Resource > ID field, select name. The ID field uniquely identifies each
resource within a group and is used for sorting and detecting missing data.
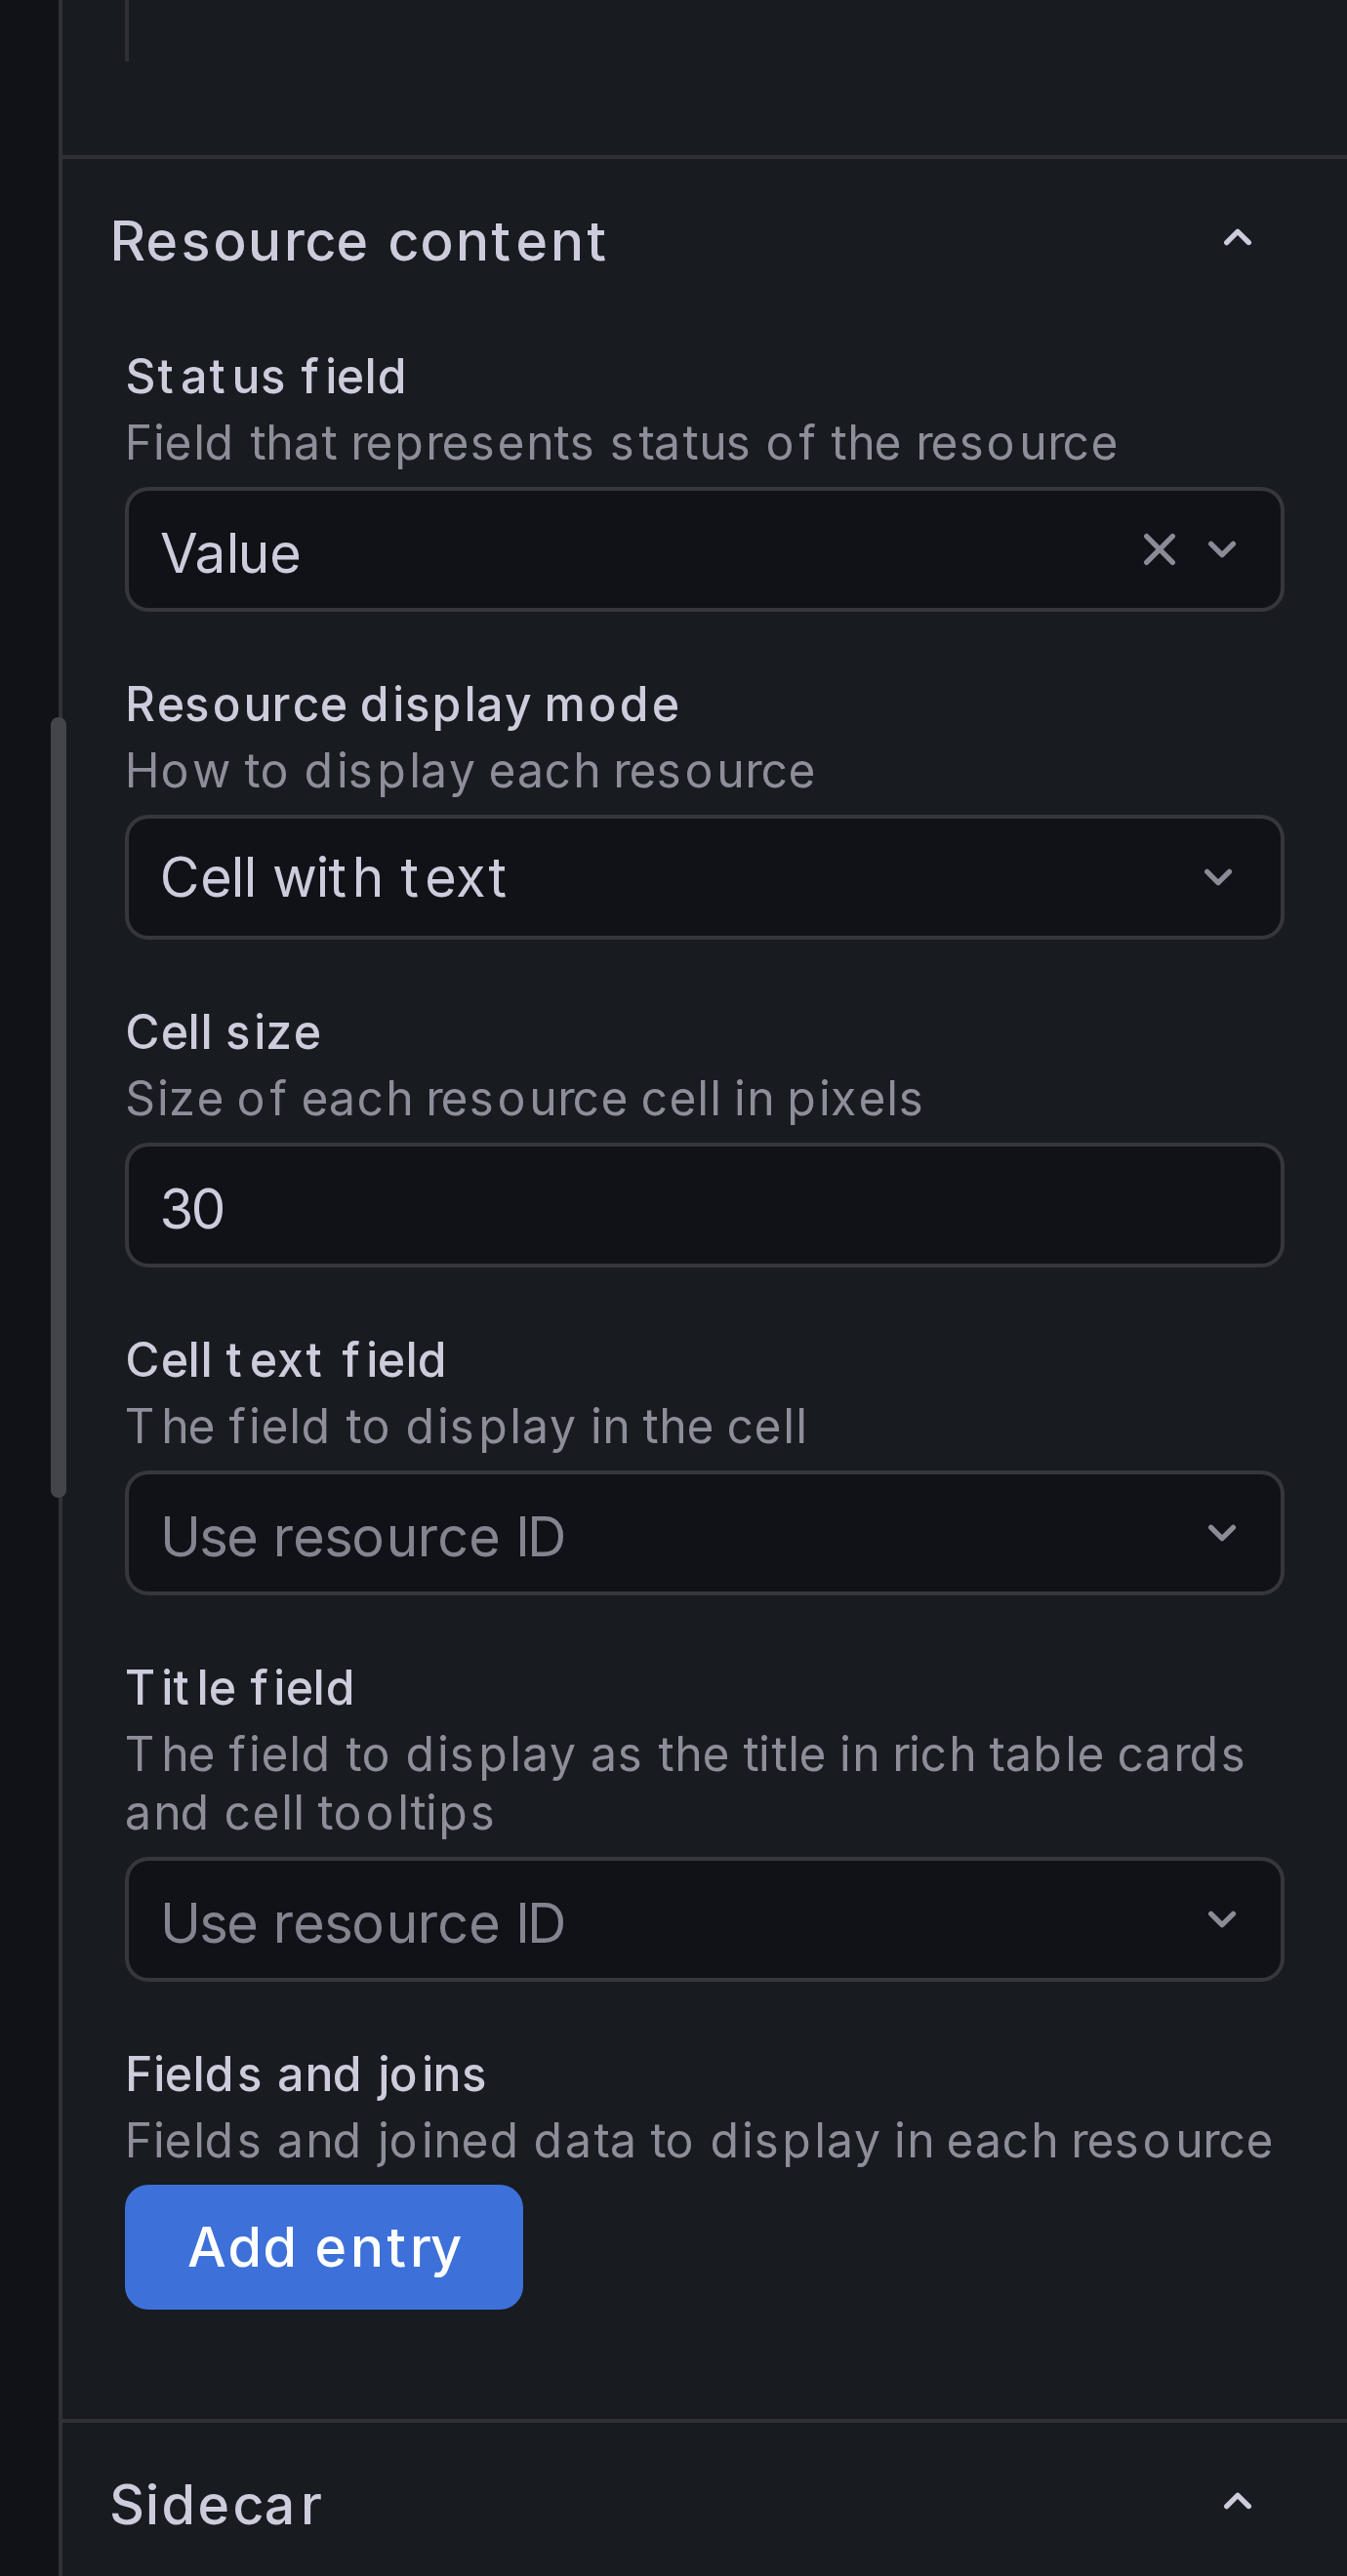
Step 7: Configure resource content
Under Resource content:
- Set Status field to
Value. - Set Resource display mode to "Cell with text".
- Set Cell size to
30.
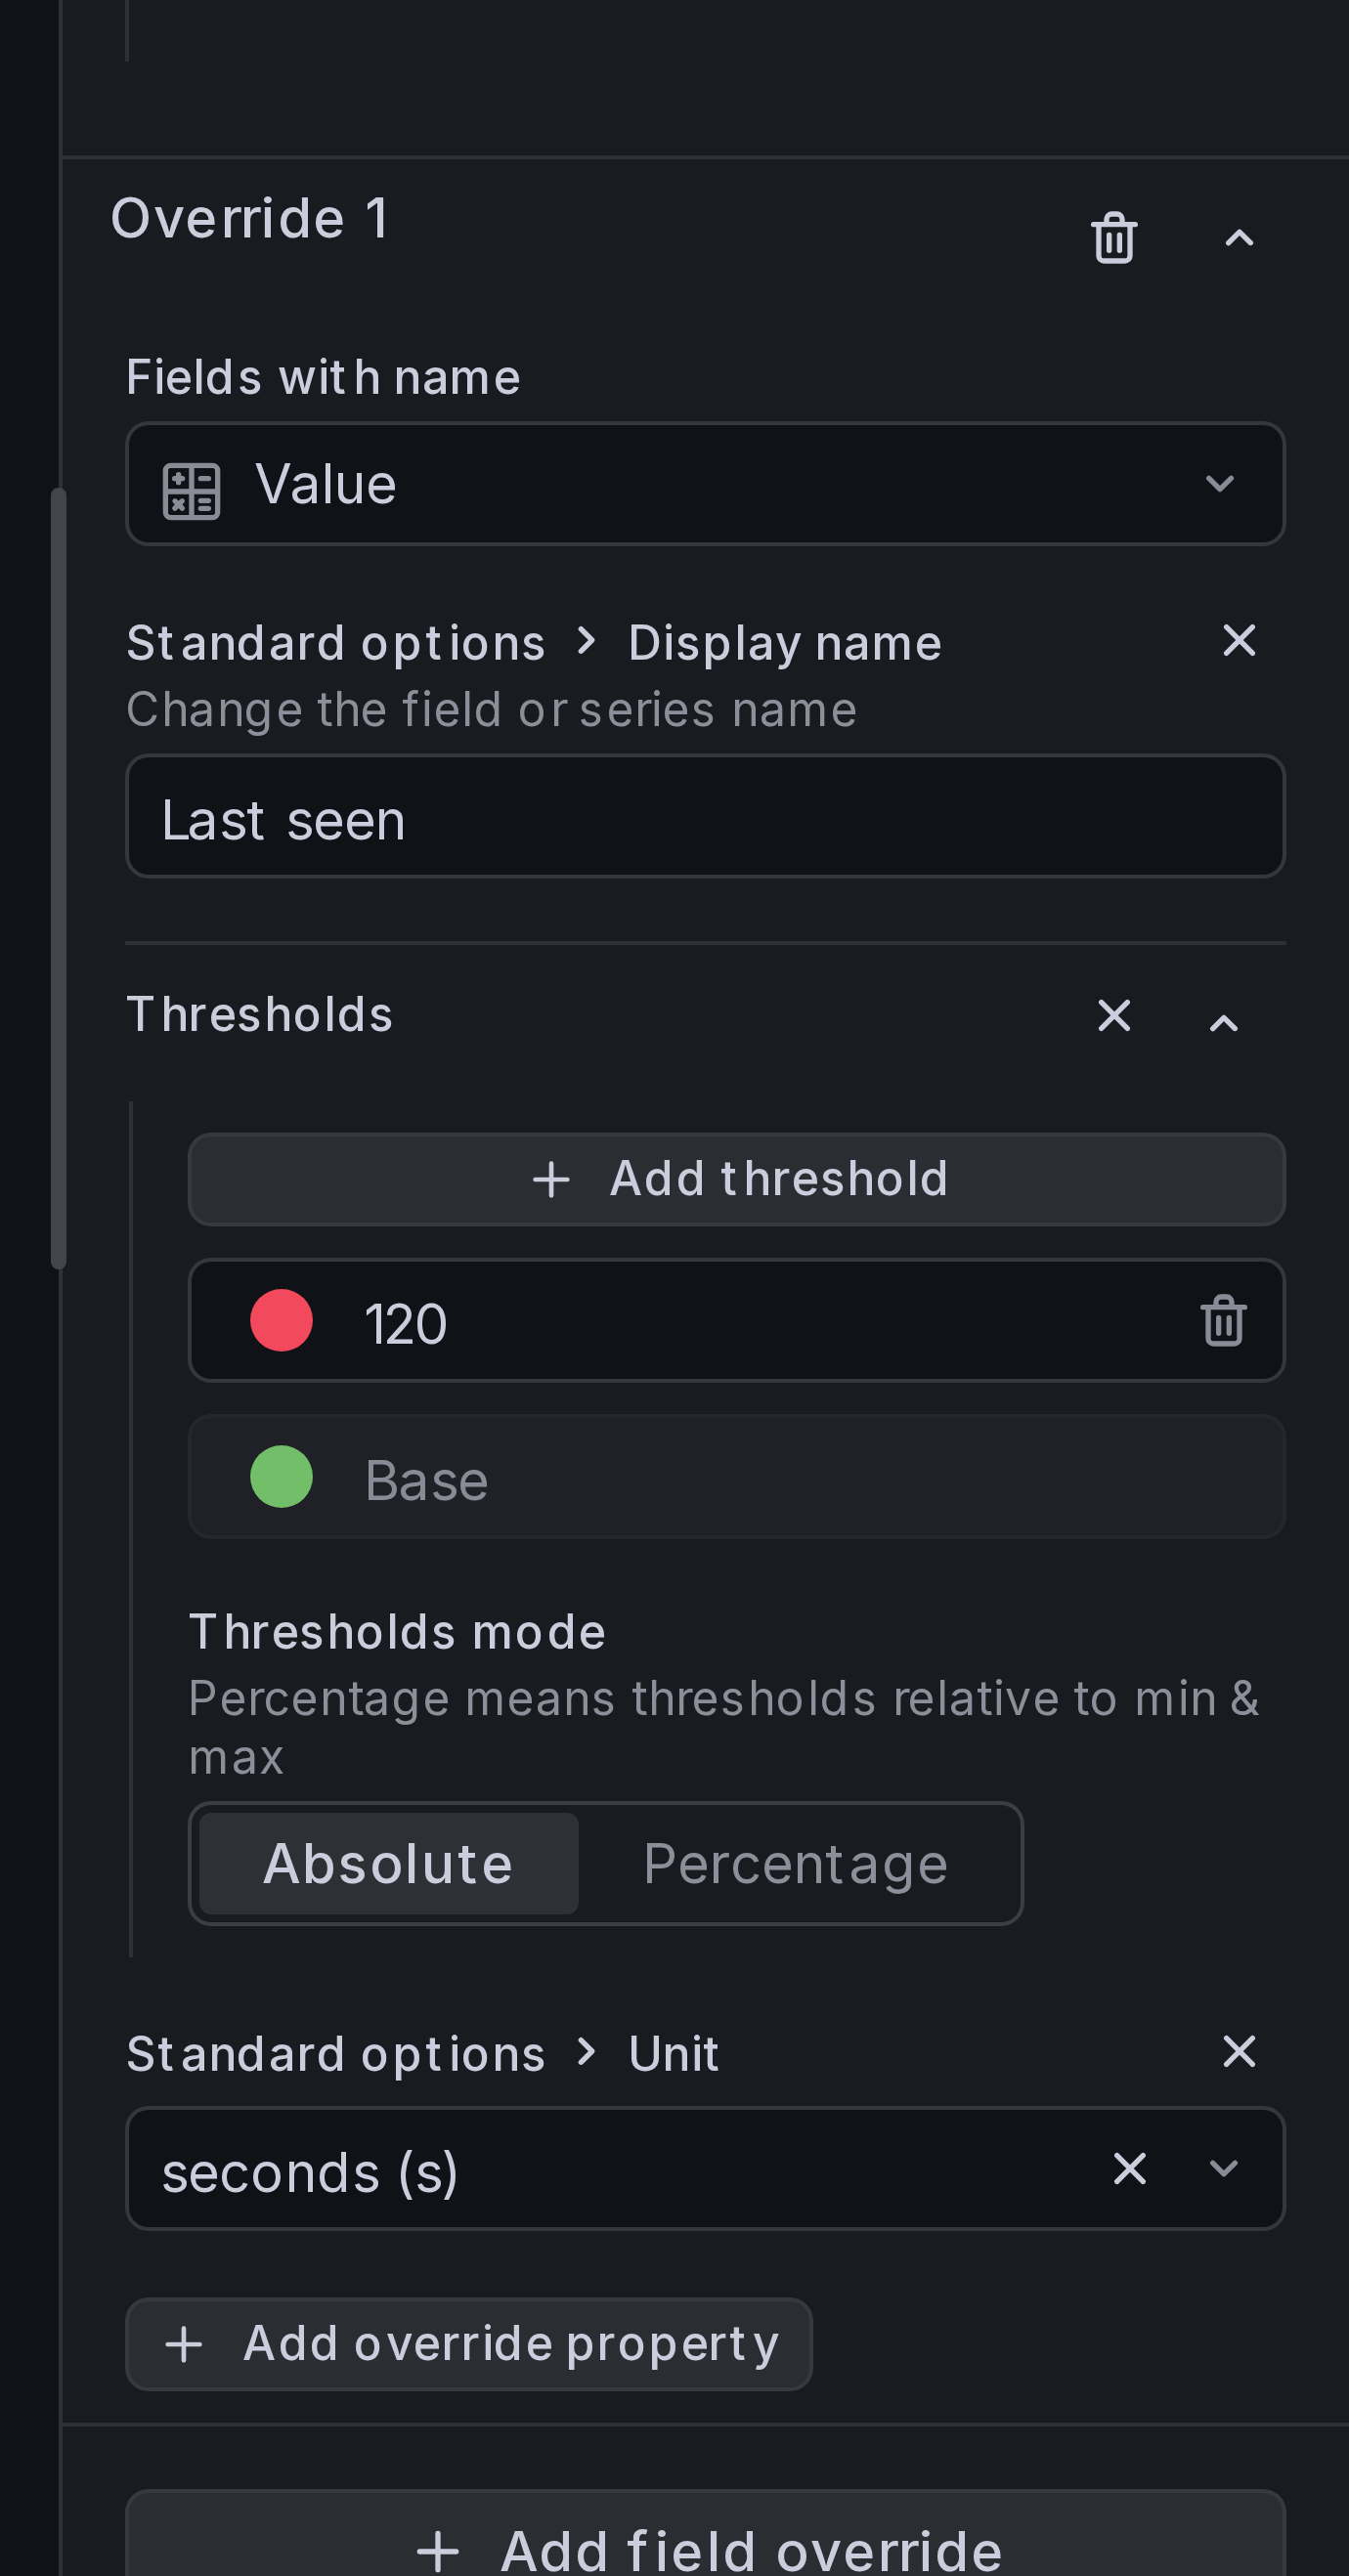
Step 8: Add field overrides
Add a field override (type: "Fields with name") for the Value field:
- Override Display name to give it a friendlier label.
- Override Threshold to set different colors for different "last seen" values.
- Override Unit, set it to "seconds".
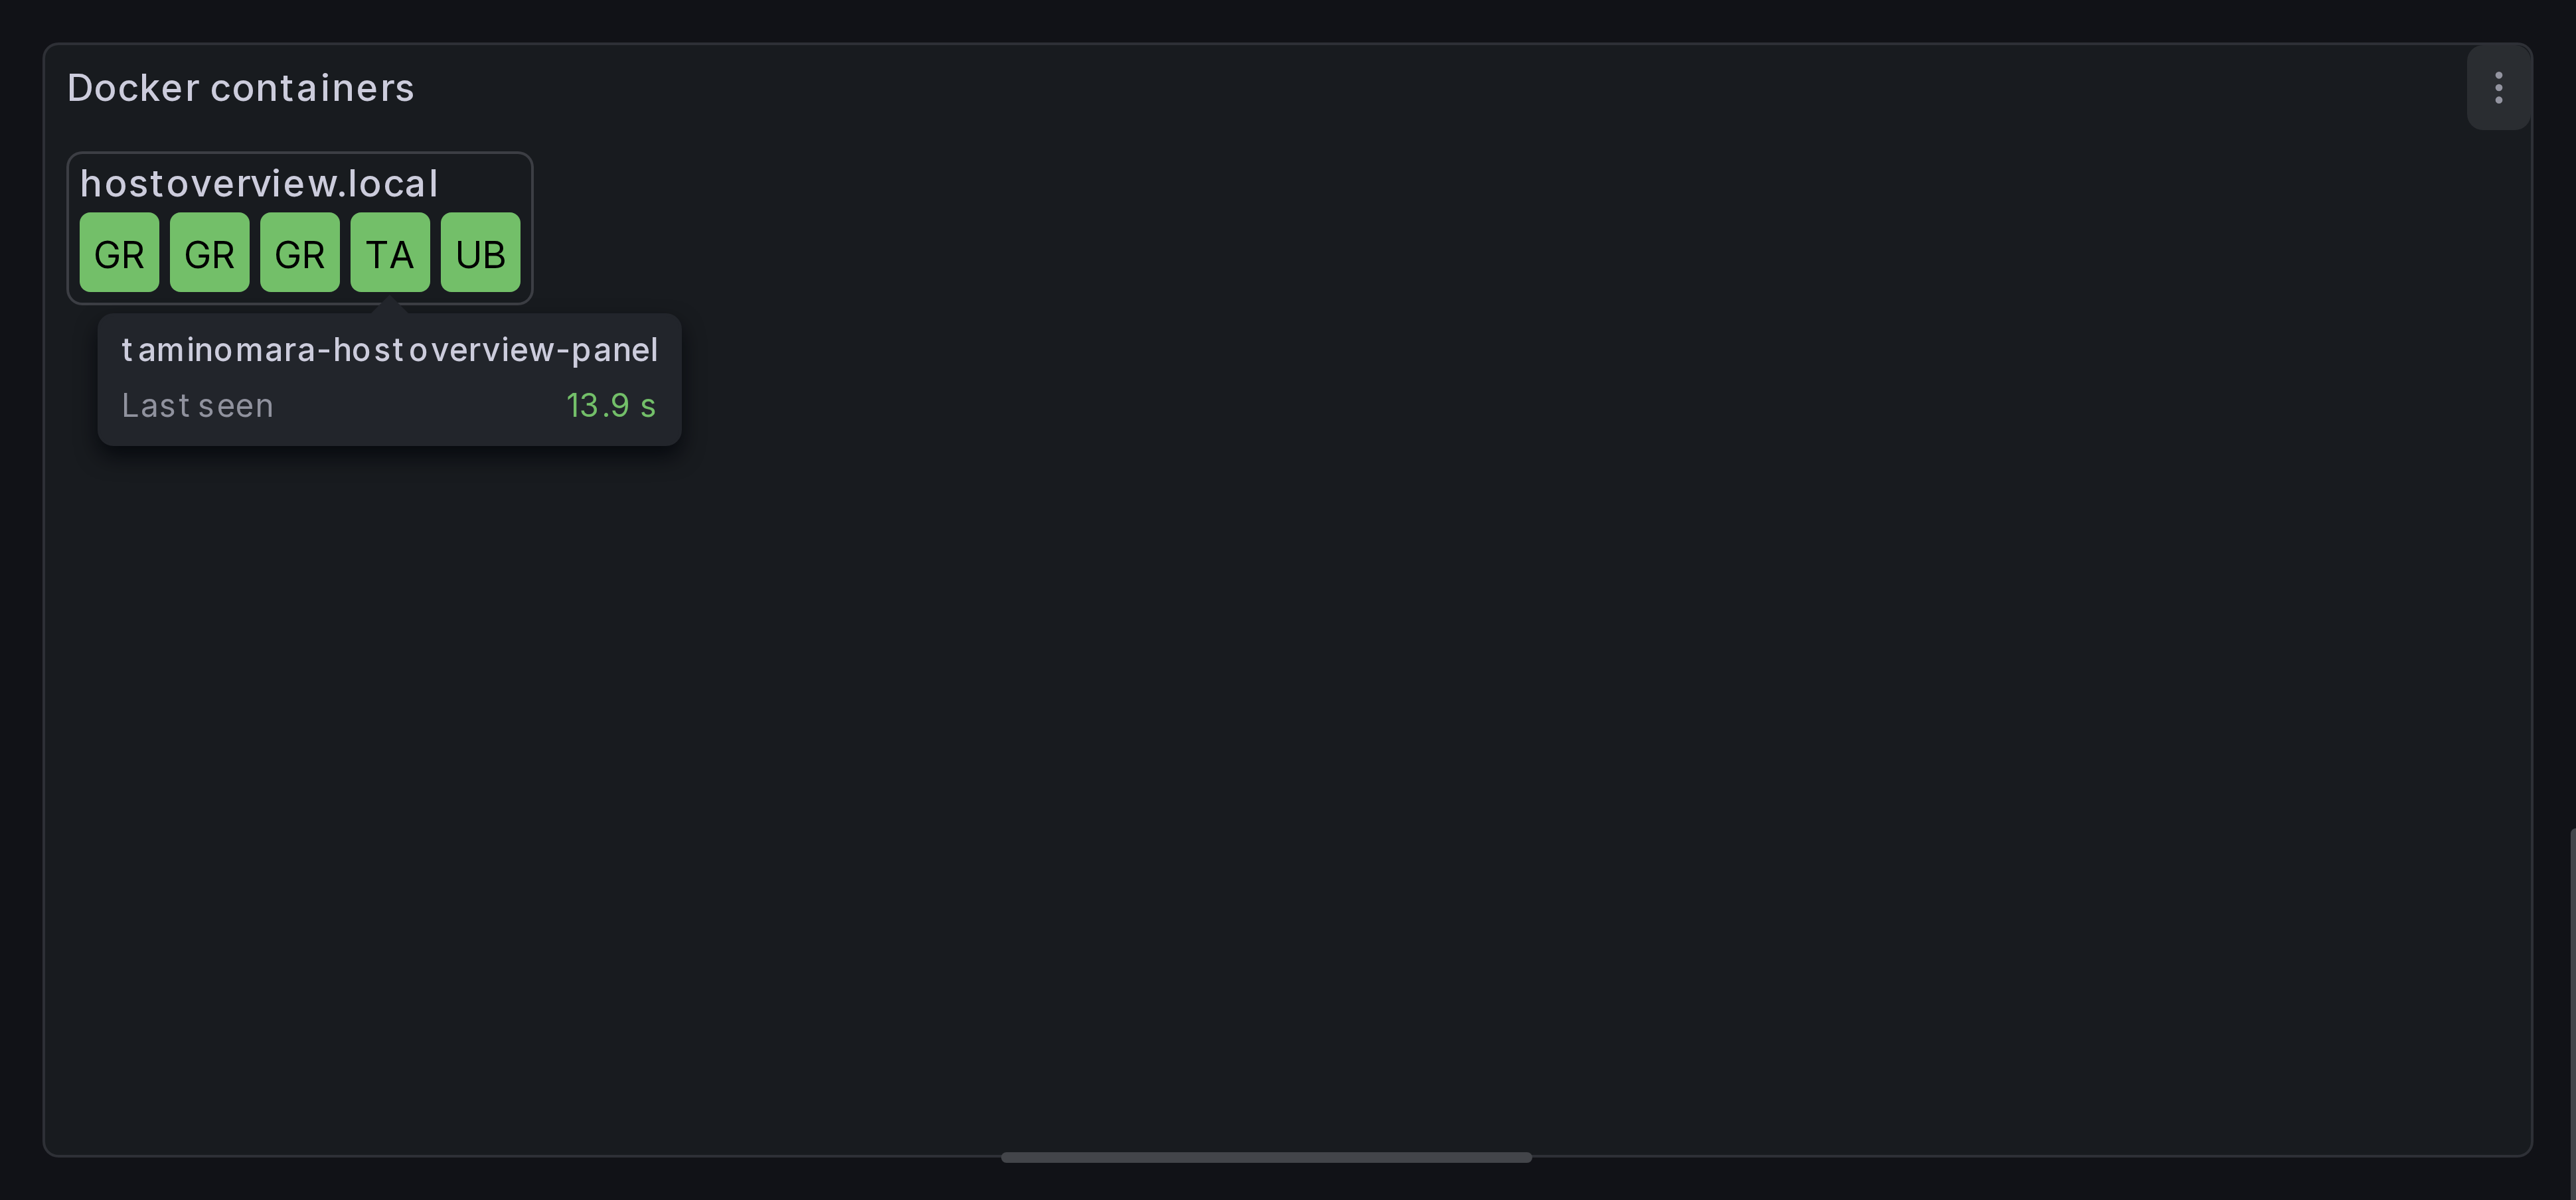
Result
You should now see colored cells for each container, grouped by host, with text labels showing the container name.