Adding more data
In the previous section we've displayed all docker containers. In this section, we'll add more info to tooltips and host groups.
Step 1: Select primary frame
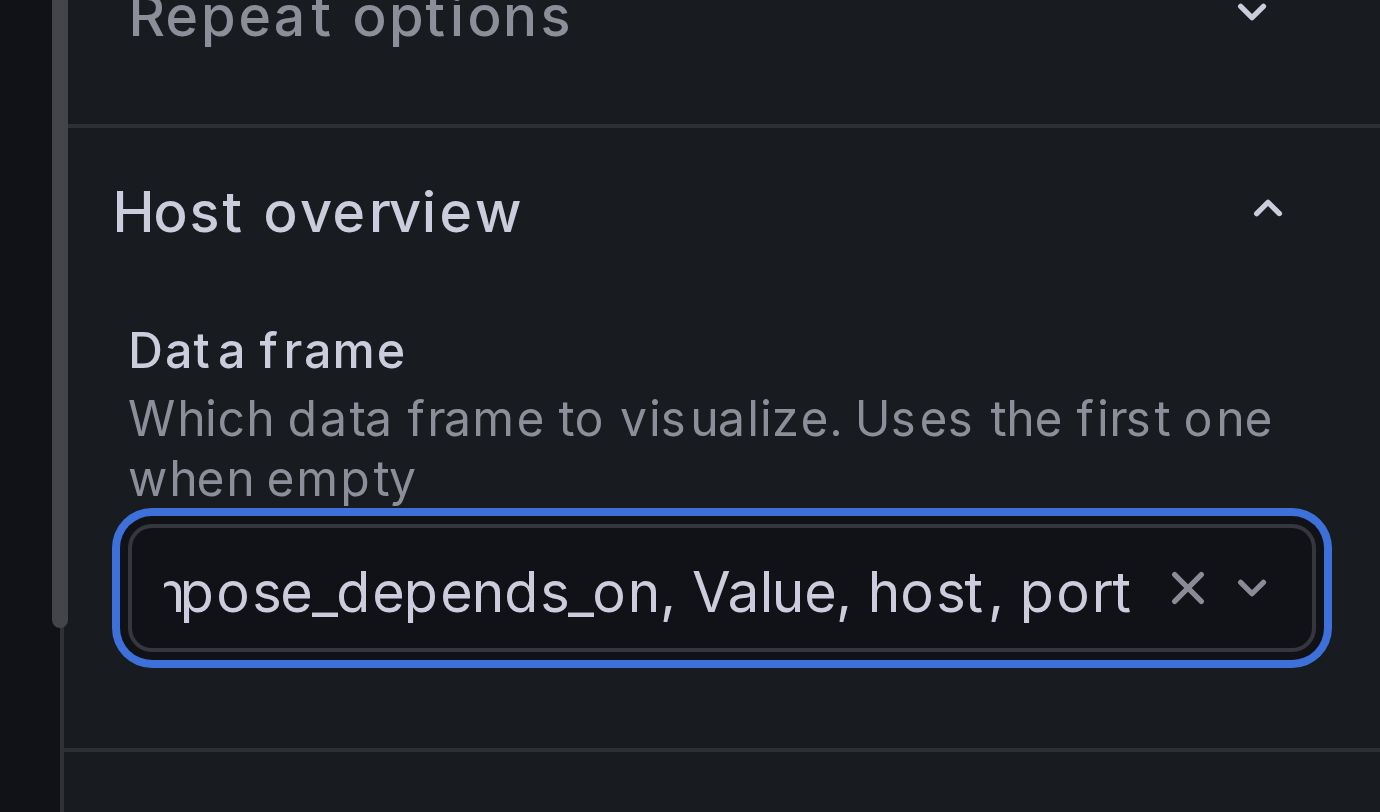
We're going to add more queries to our panel. Before we begin, we need to select which query returns primary data which is used to display containers.
Under Host Overview > Data frame, select UP as the primary data frame.
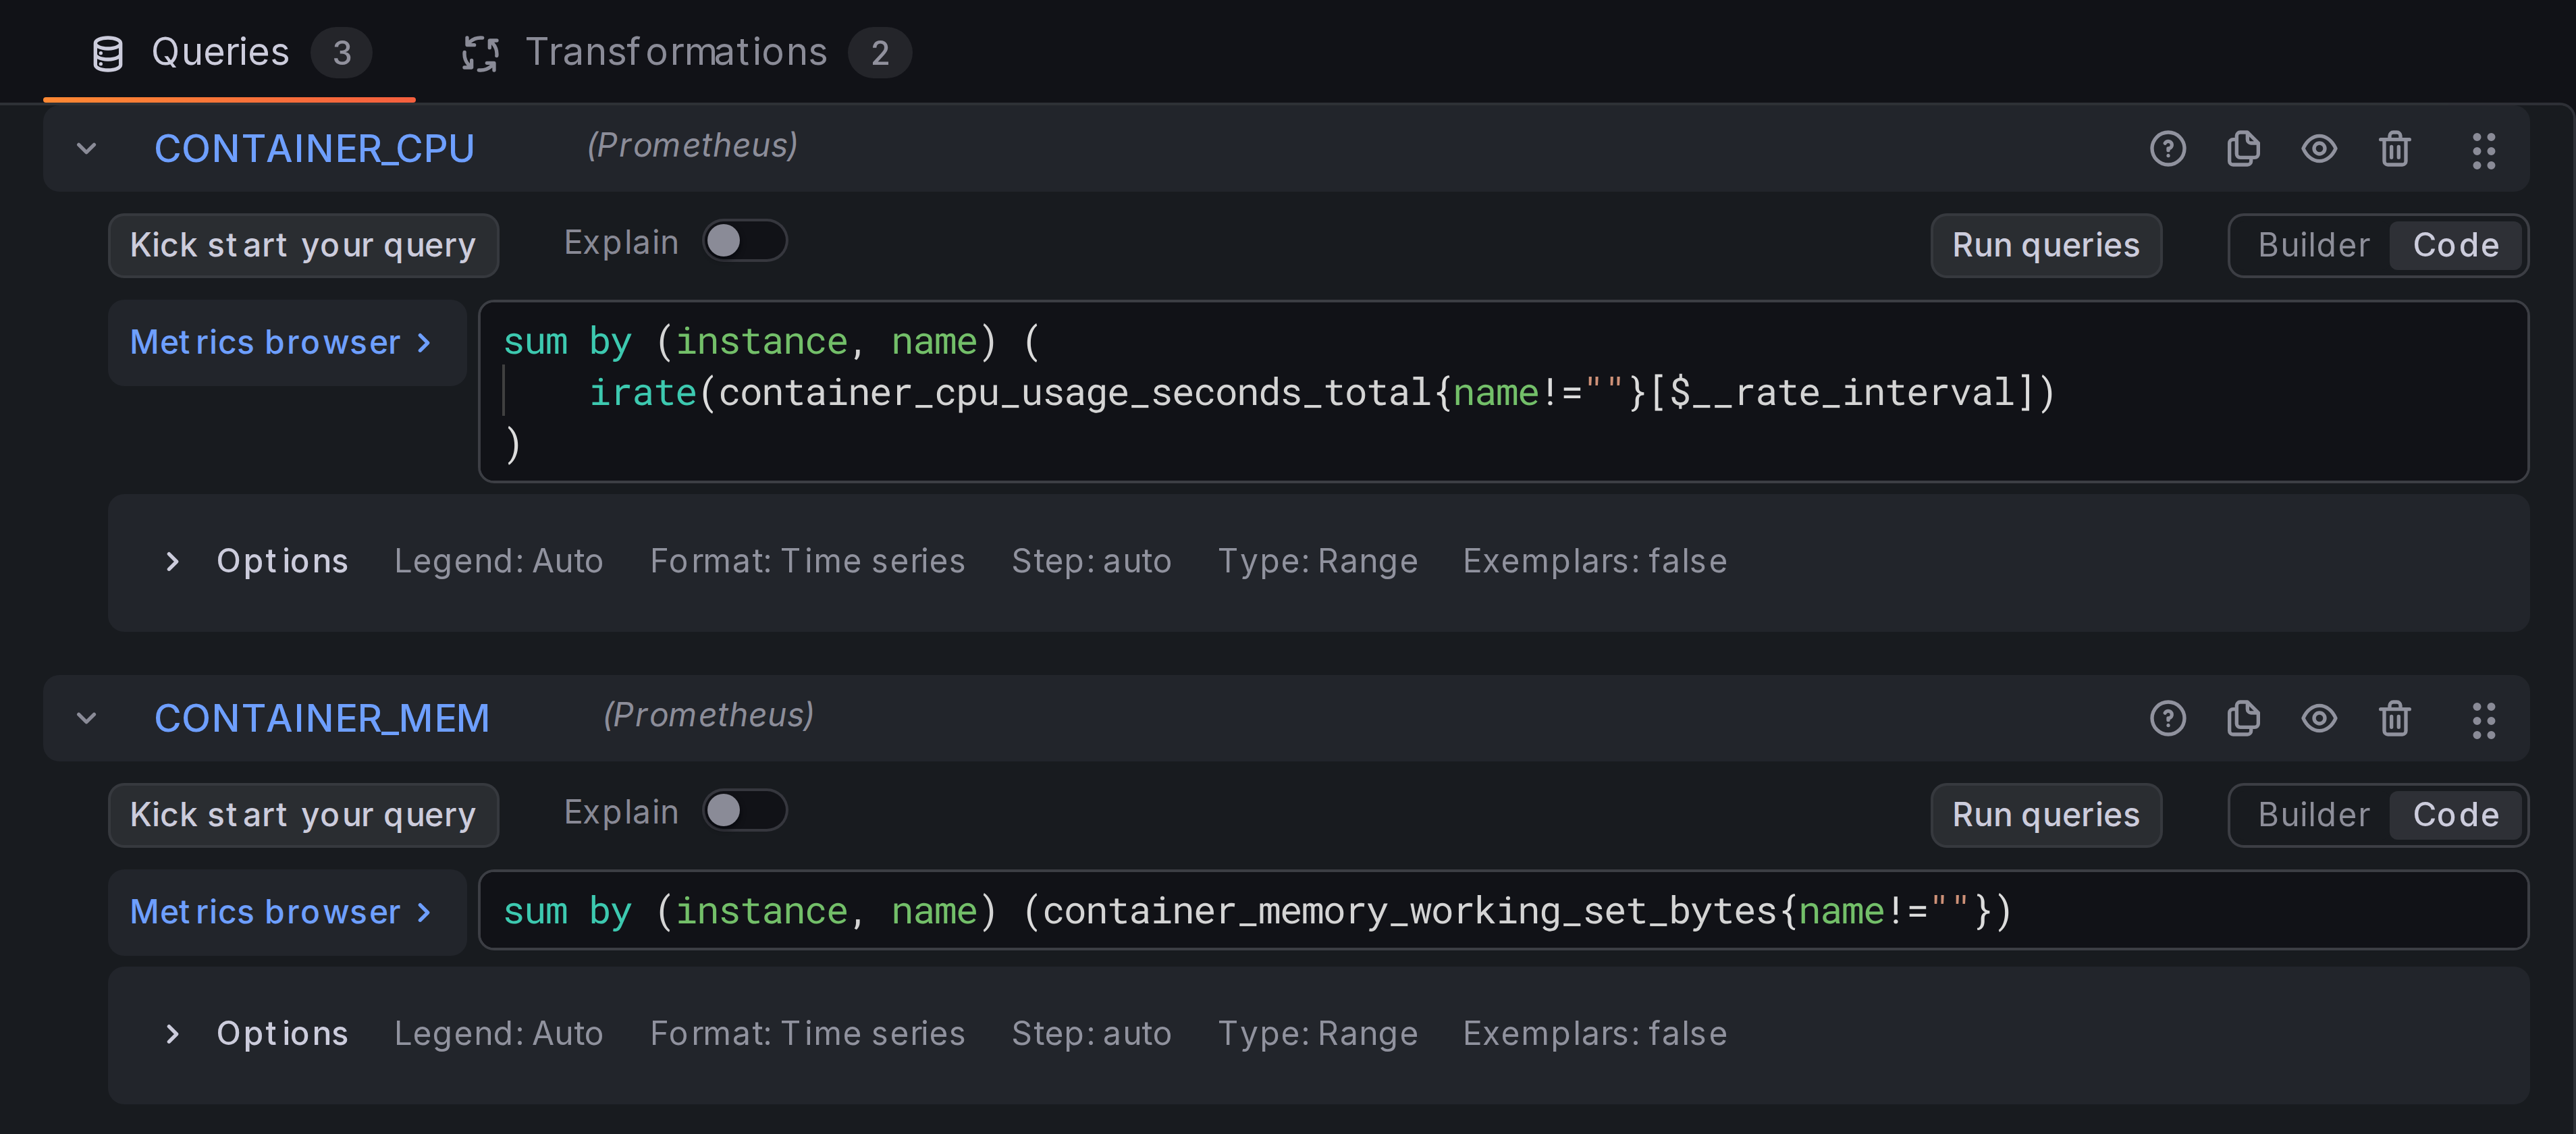
Step 2: Add queries for container metrics
Create two more queries that fetch per-container CPU and Memory usage:
sum by (instance, name) (
    irate(container_cpu_usage_seconds_total{name!=""}[$__rate_interval])
)
sum by (instance, name) (container_memory_working_set_bytes{name!=""})
Set the query type to Range and the format to Time series: we'll use sparkline visualization for both.
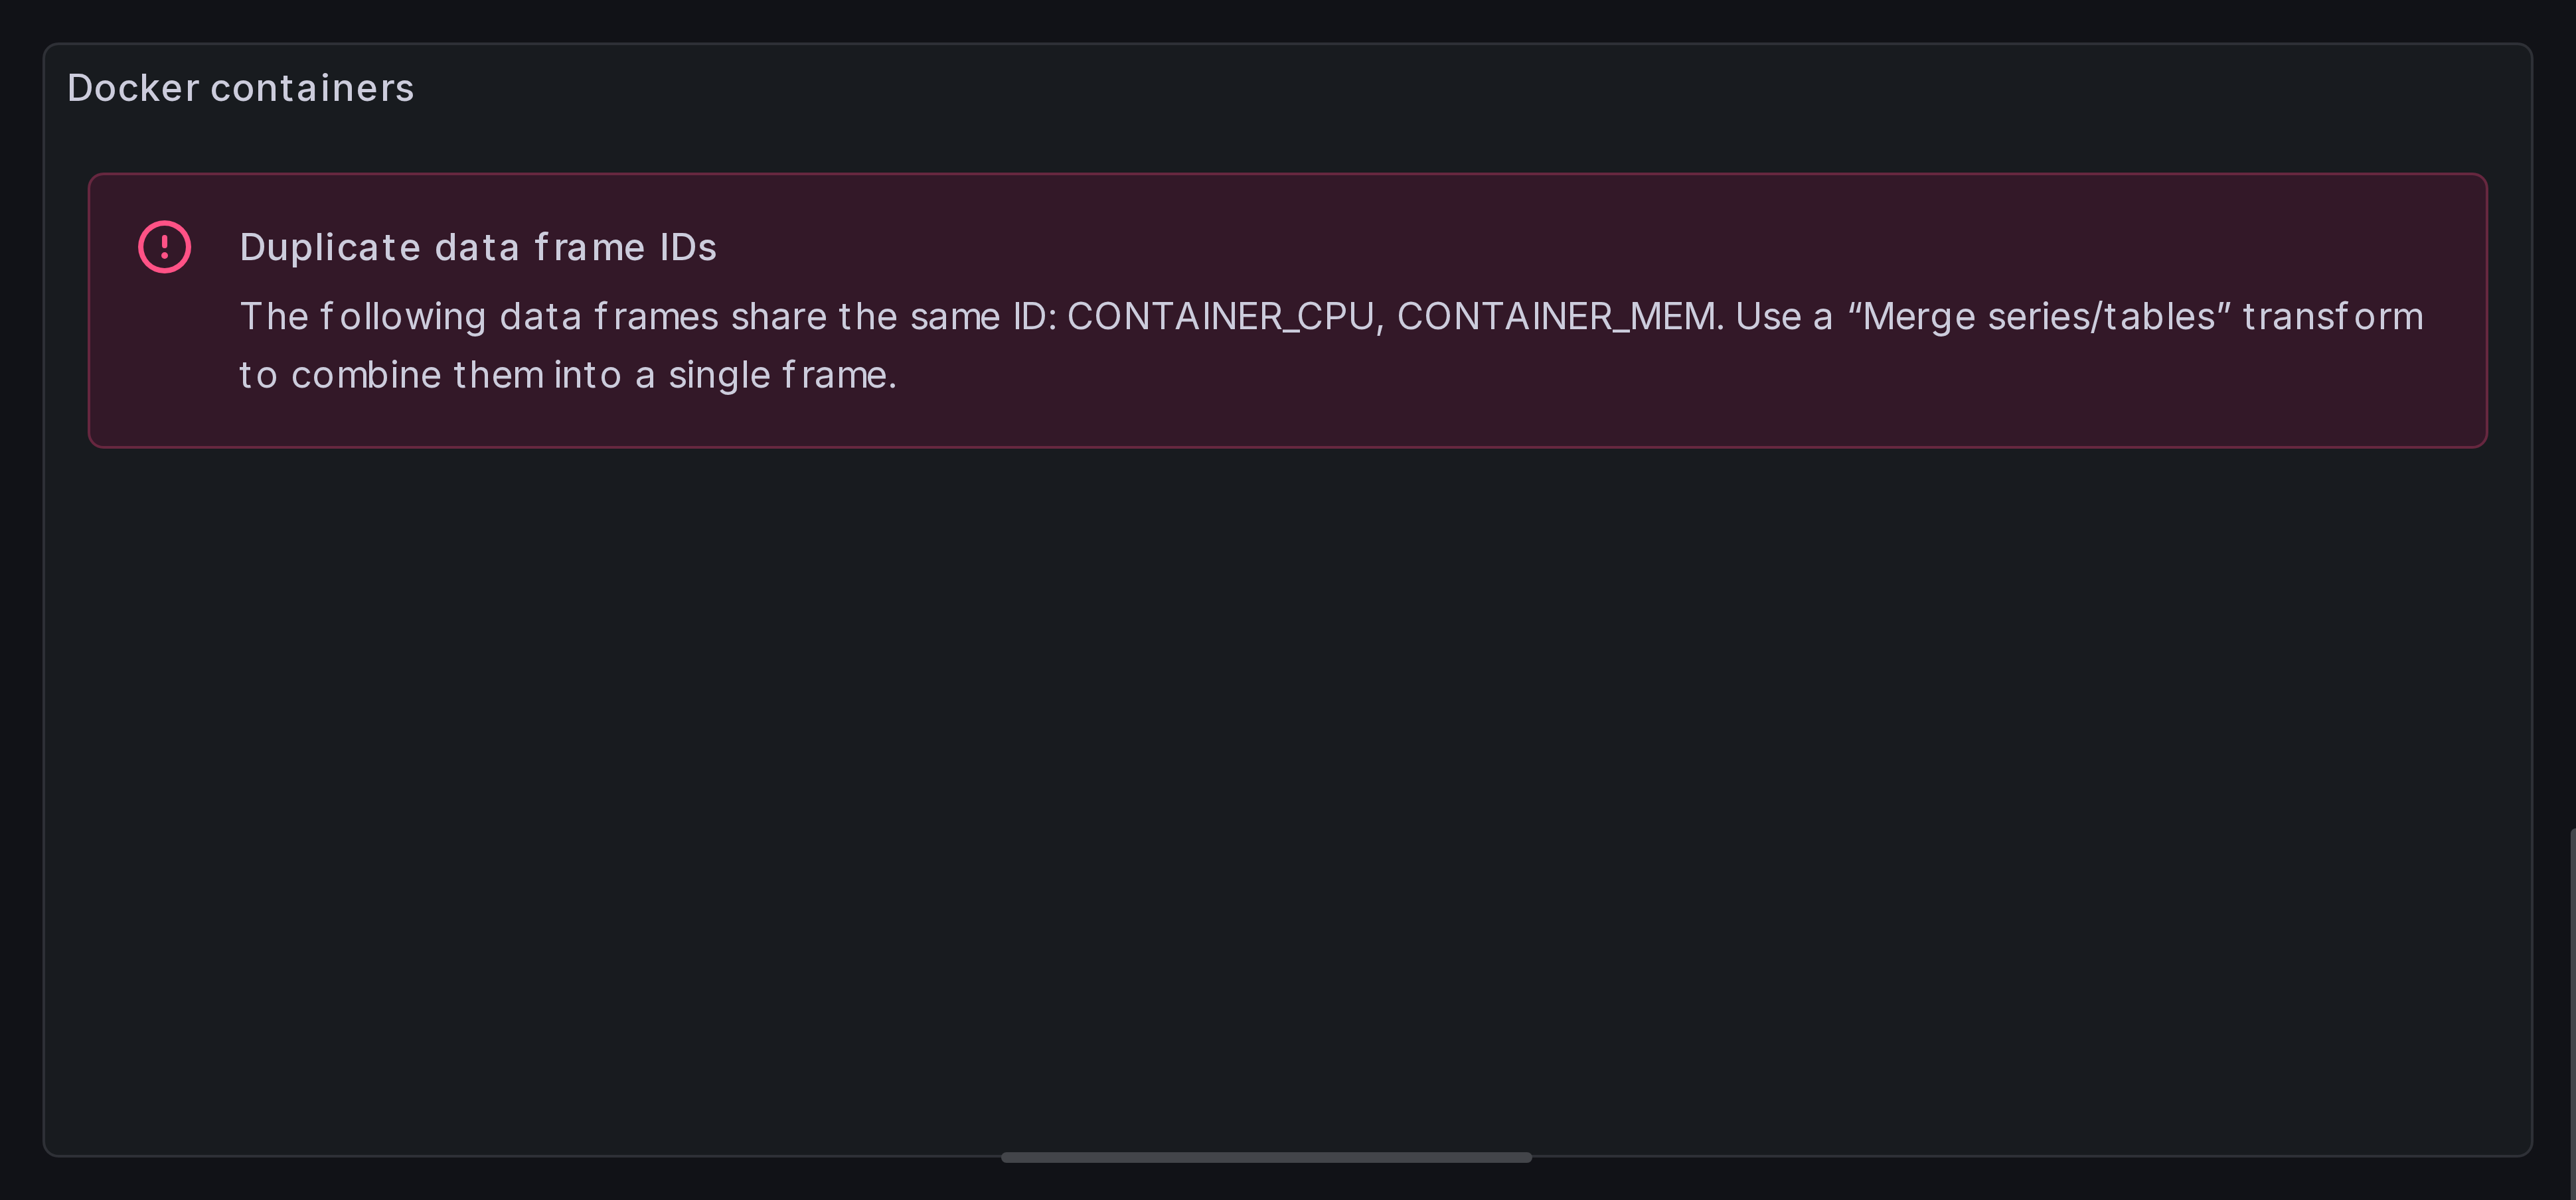
Note
The panel might complain about having multiple frames with the same IDs. This is expected and will be addressed in the next step.
Step 3: Convert time series to a table with sparklines
We have two queries returning multiple time series, each in its own data frame. We need to join them into a single data frame.
Add a new transformation, Time series to table. Move it before Extract fields:
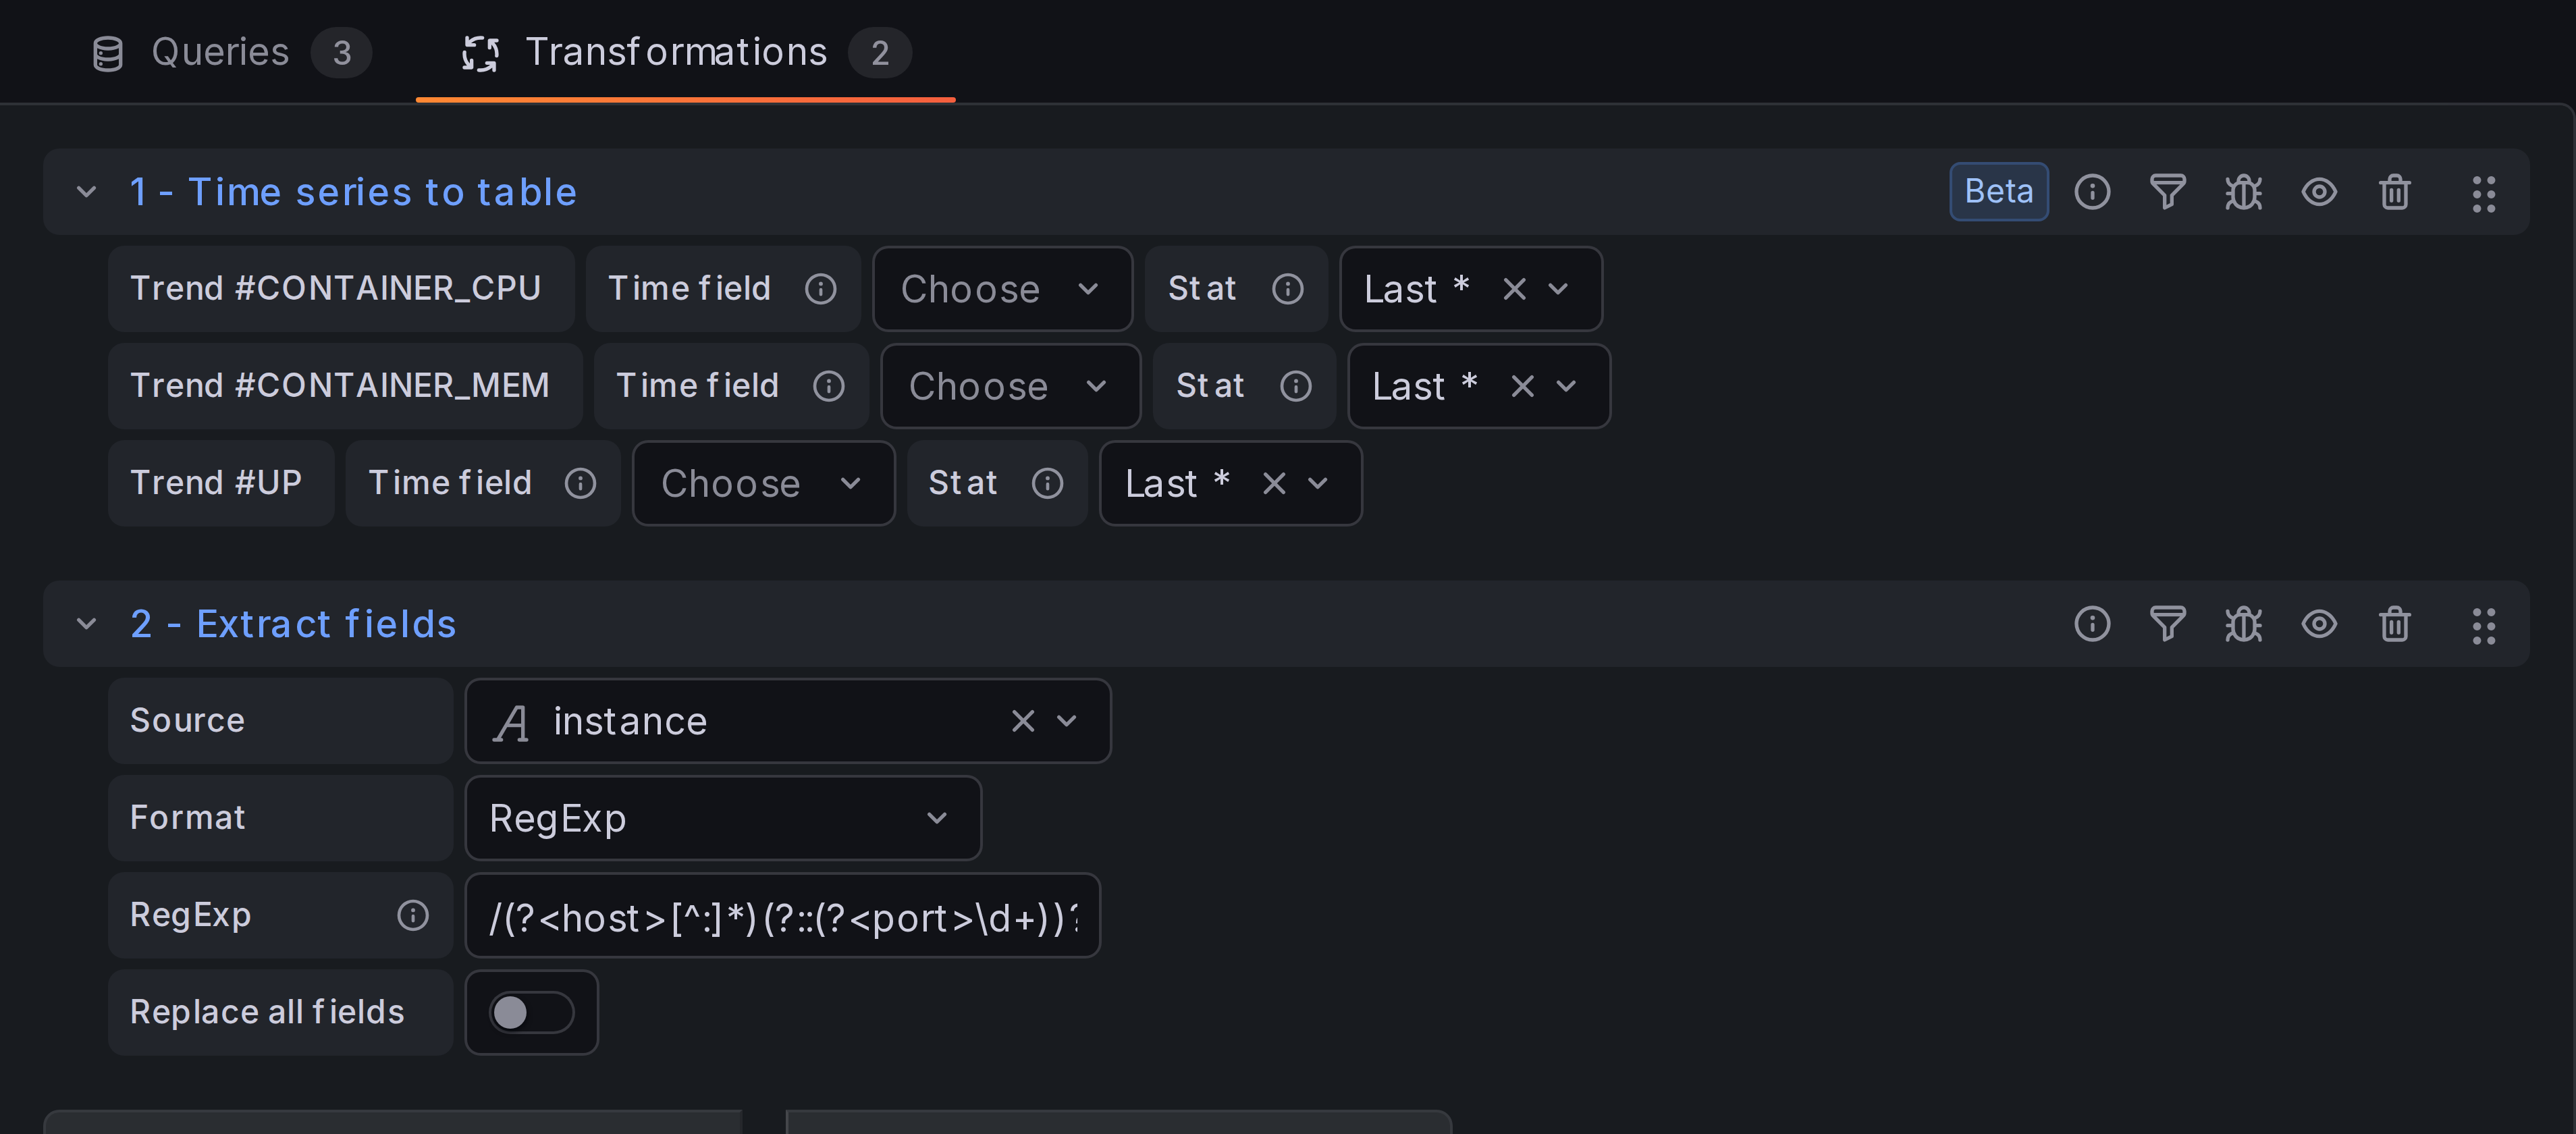
Tip
Table view is your friend.
If you don't understand how your data is laid out, switch preview to the Table view:
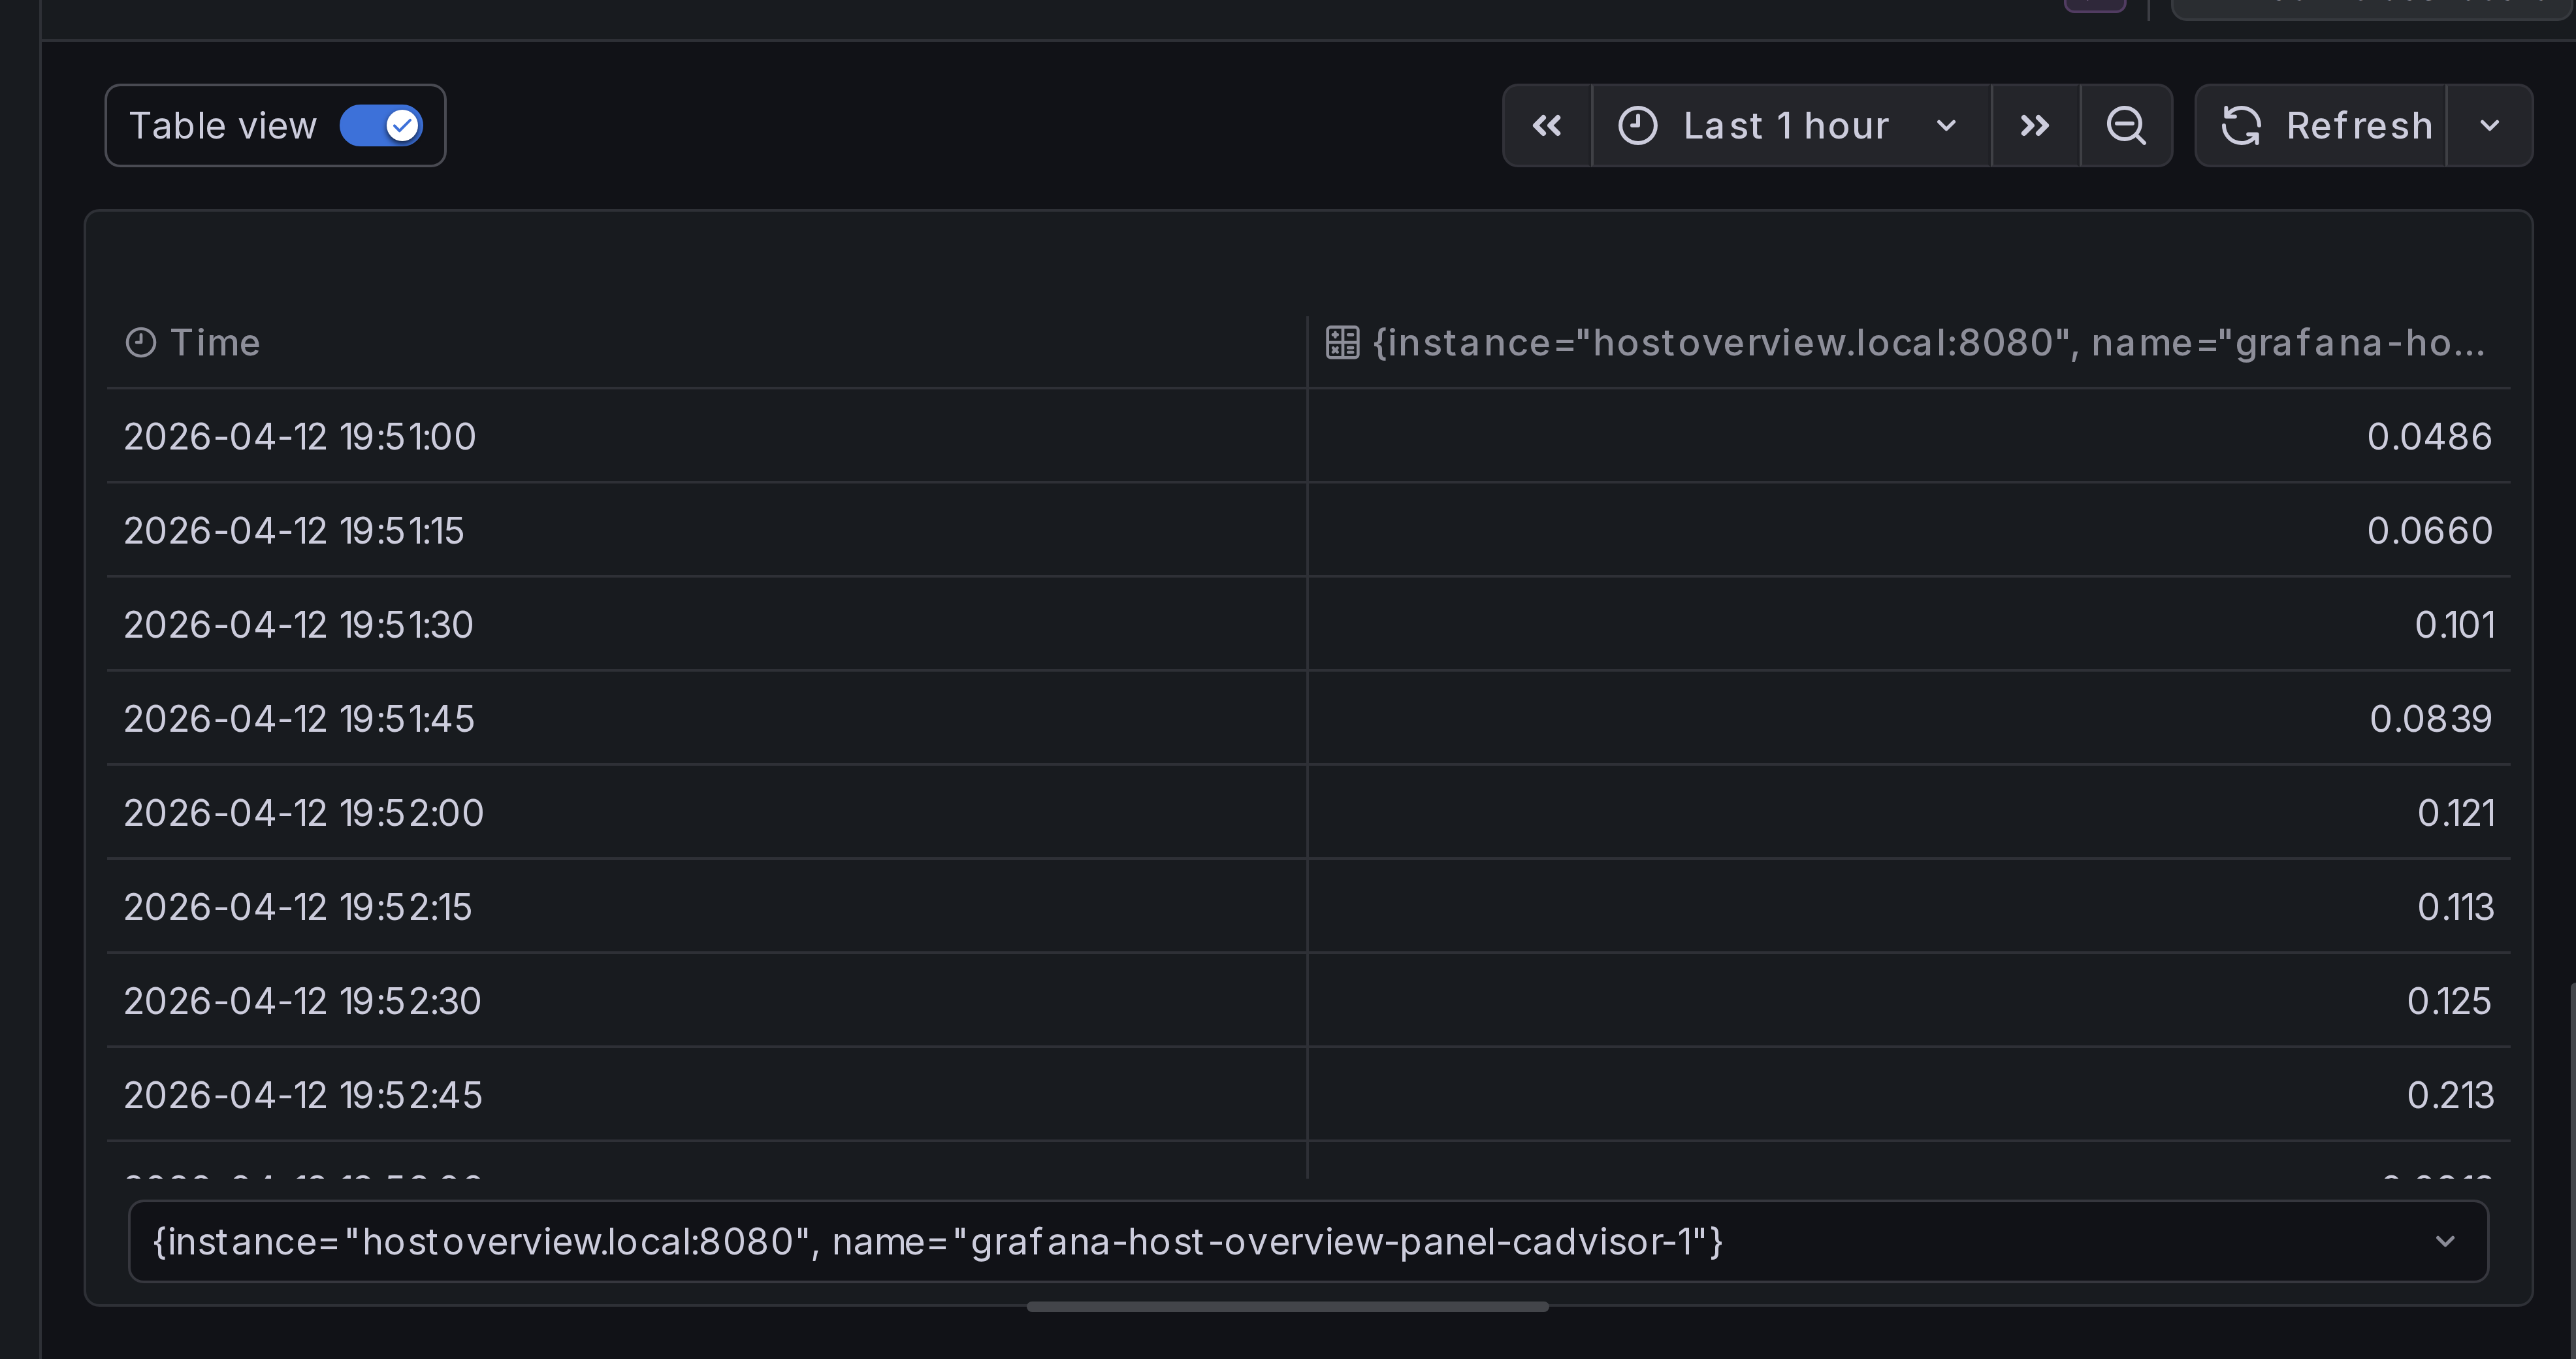
Each table represents a data frame: a unit of information that the panel can visualize. You can switch between data frames using the selector below the table.
Step 4: Configure tooltip contents
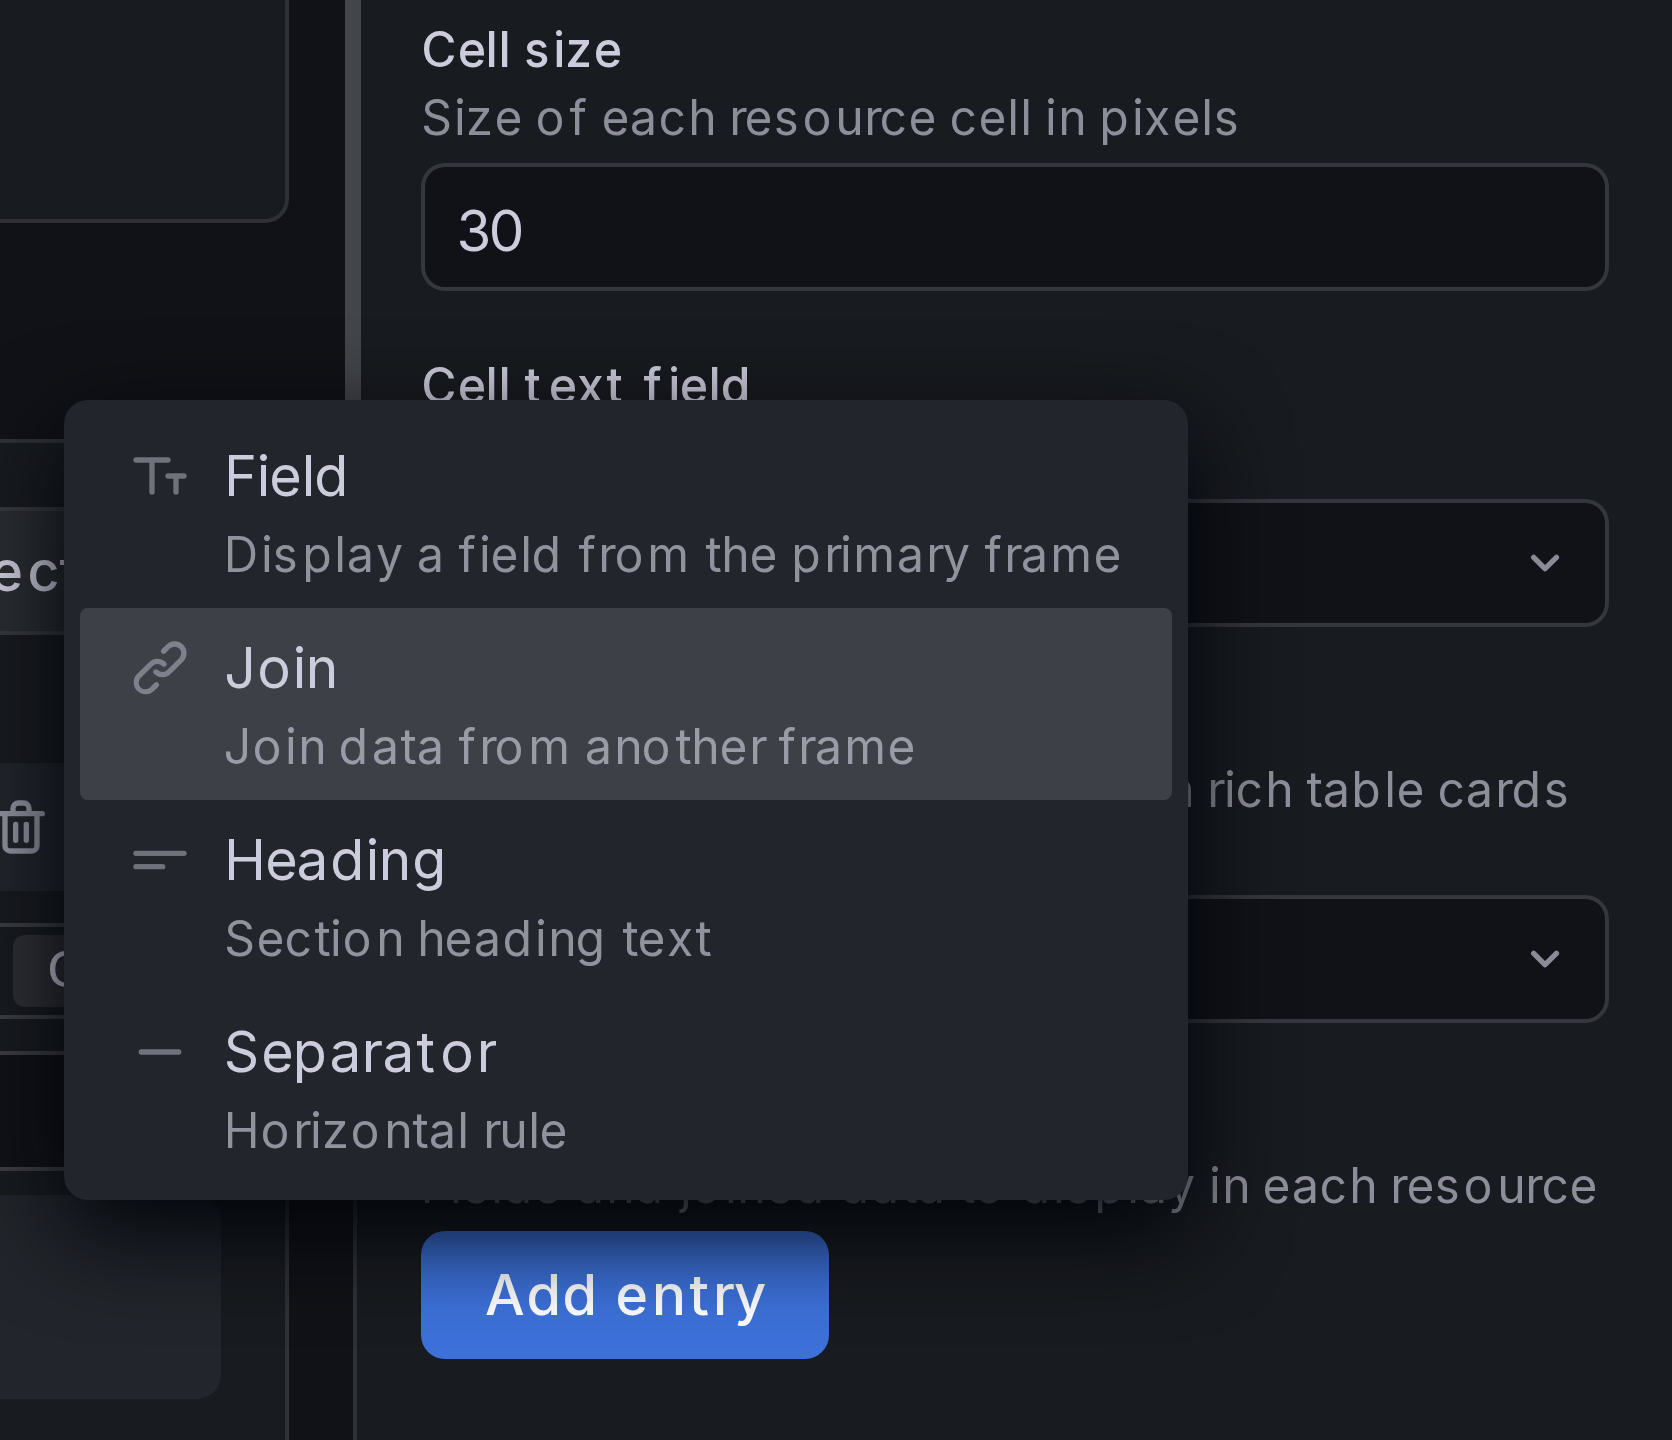
Under Resource content > Fields and joins, click button Add entry and add a Join:
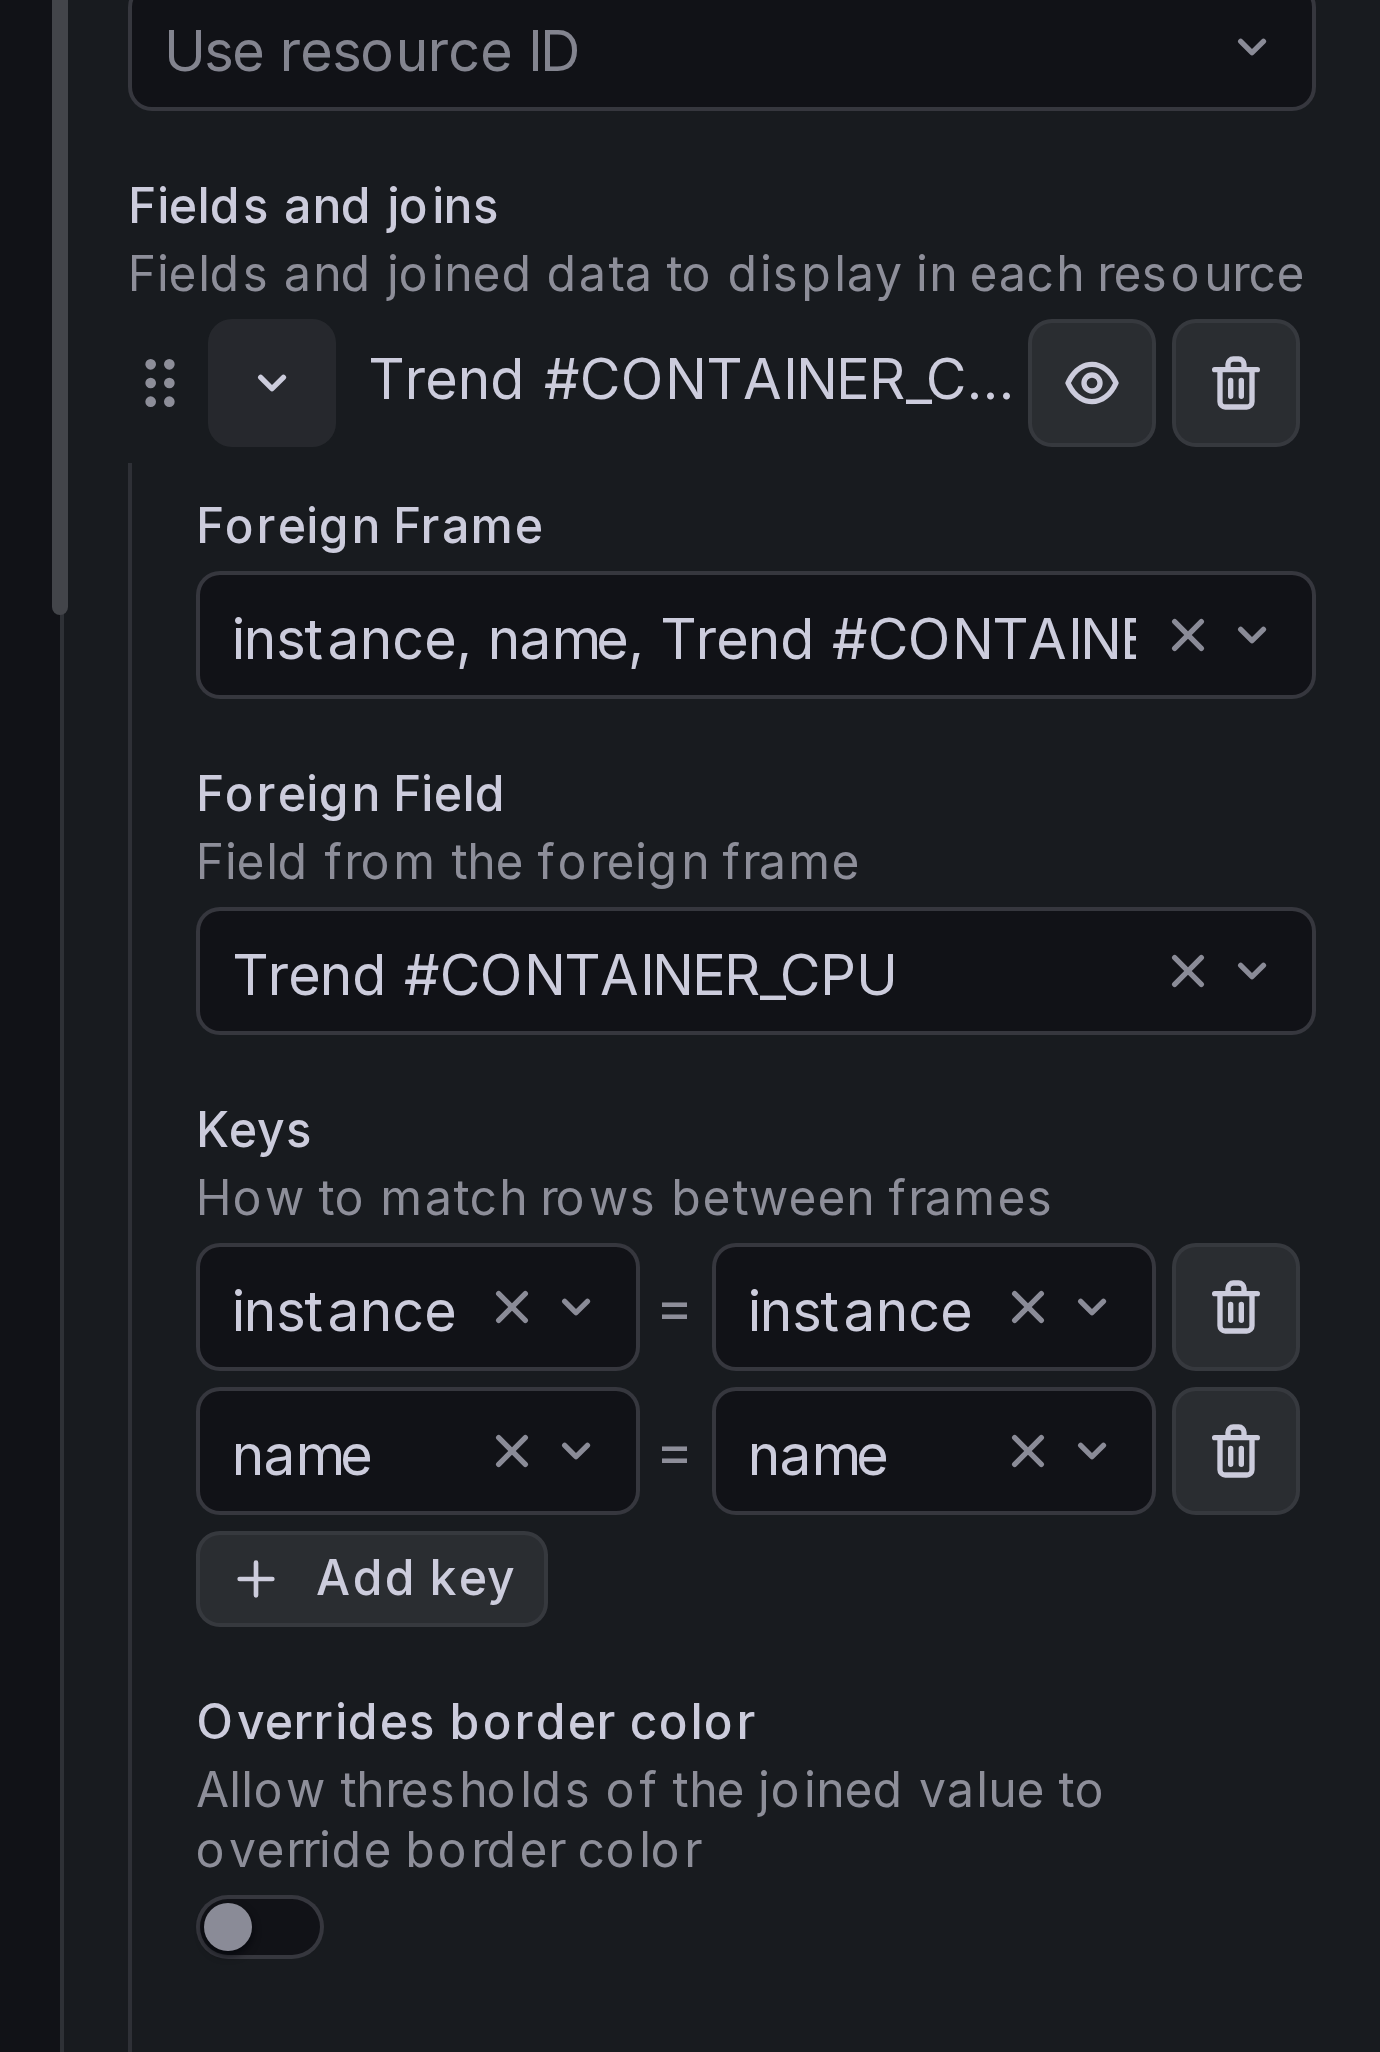
Select CONTAINER_CPU as Foreign Frame, Trend #CONTAINER_CPU as Foreign Field.
Add join keys instance and name:
In a similar way, add join for container memory.
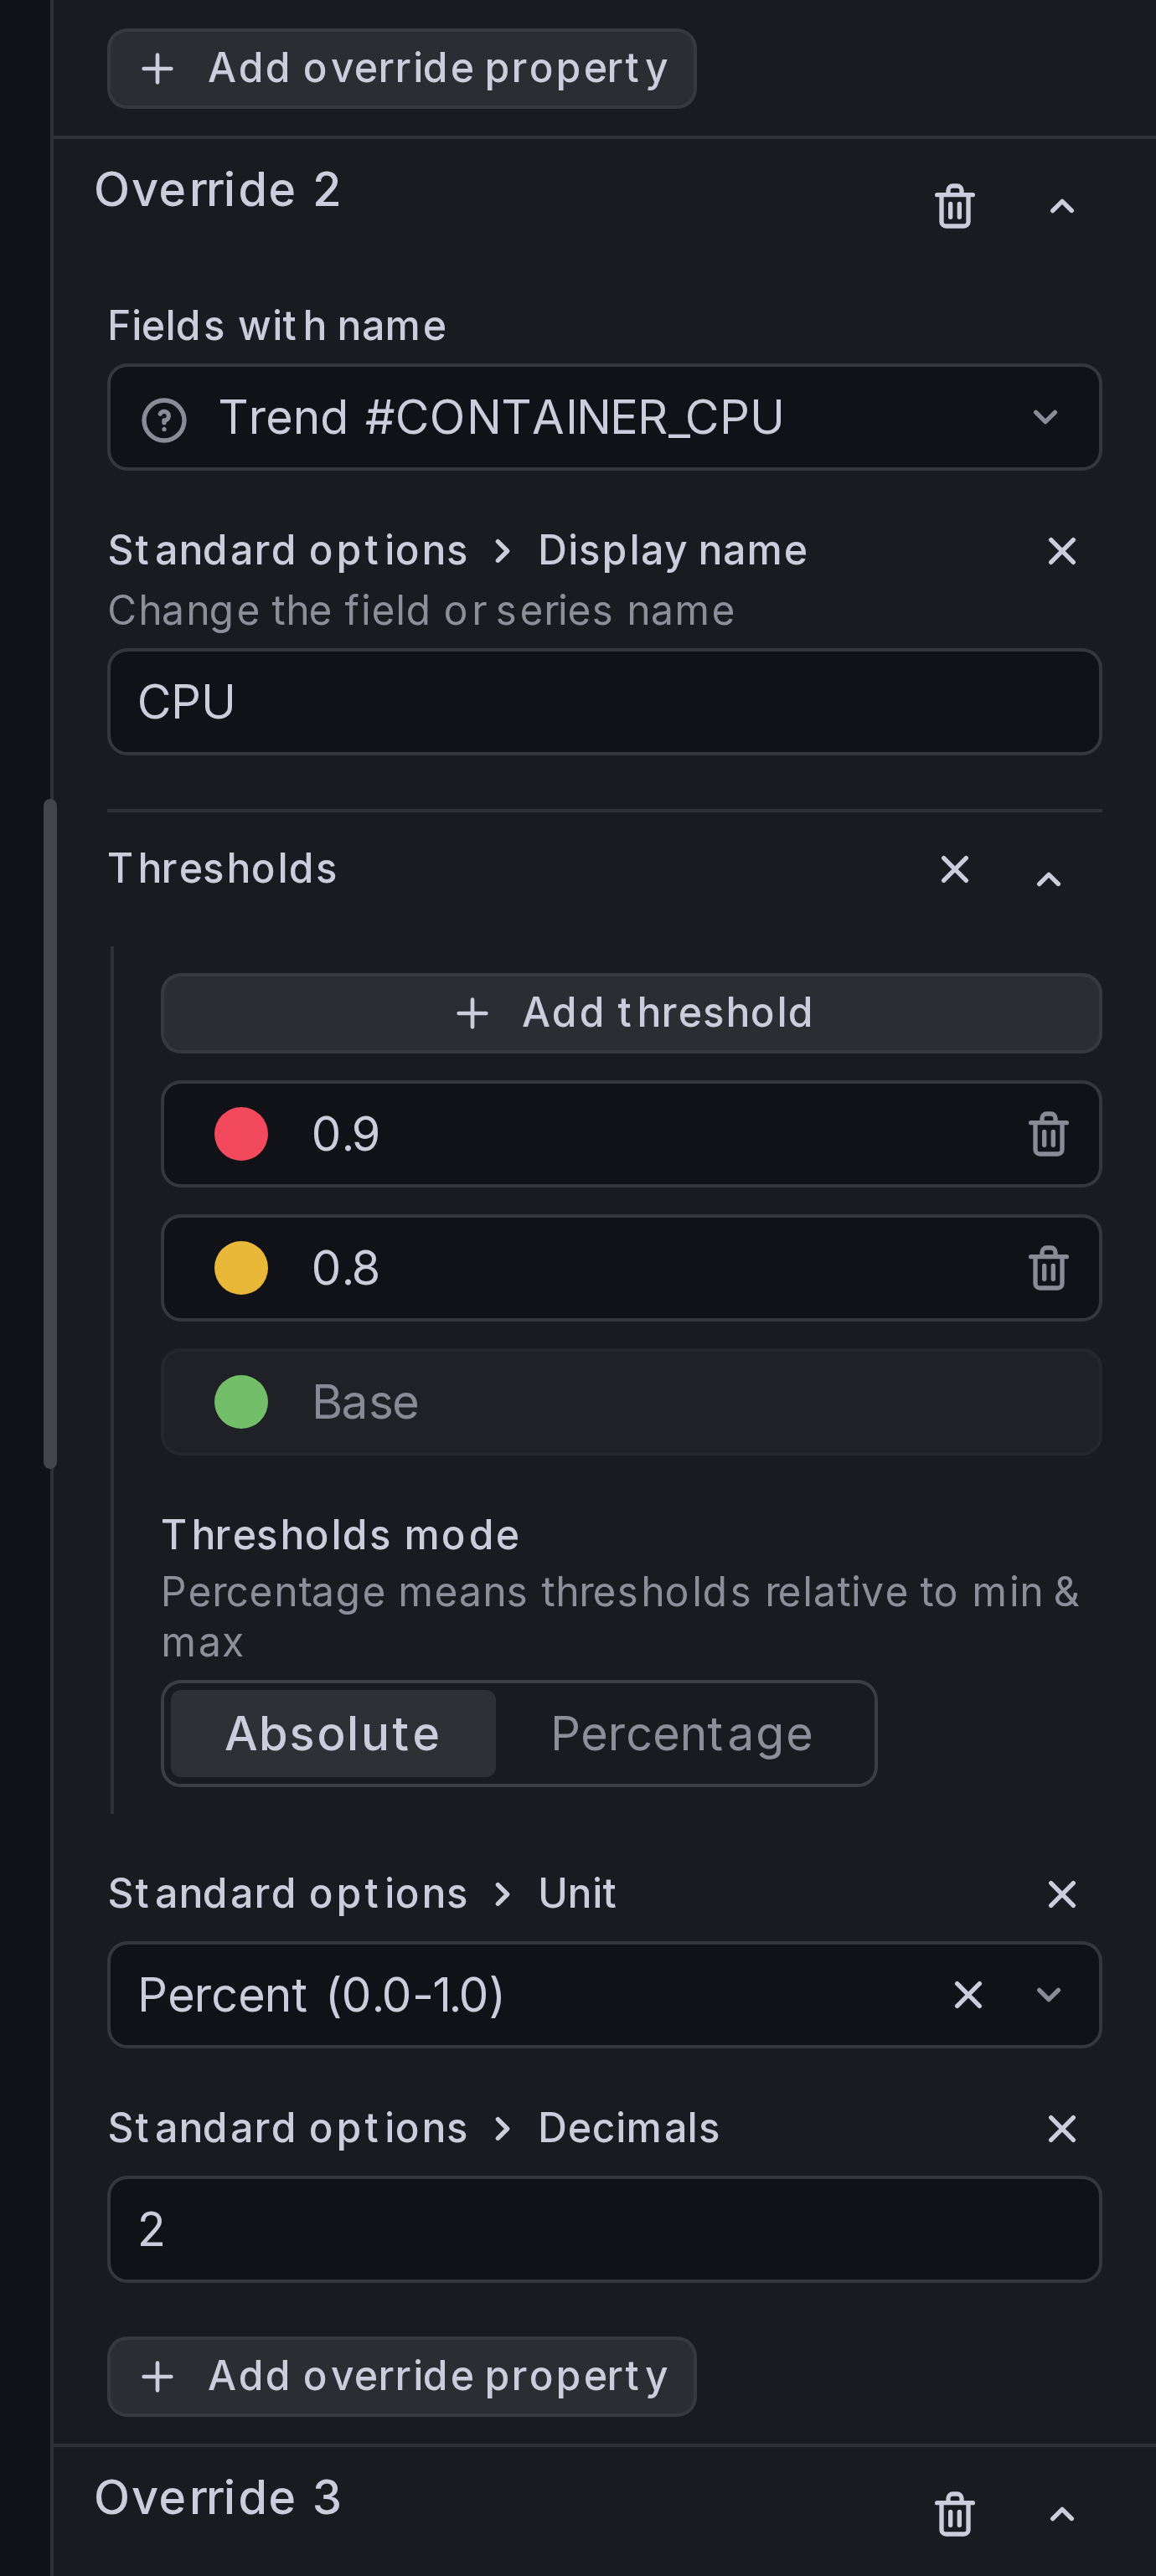
Step 5: Add field overrides
Add field overrides, similar to how we did for resource status:
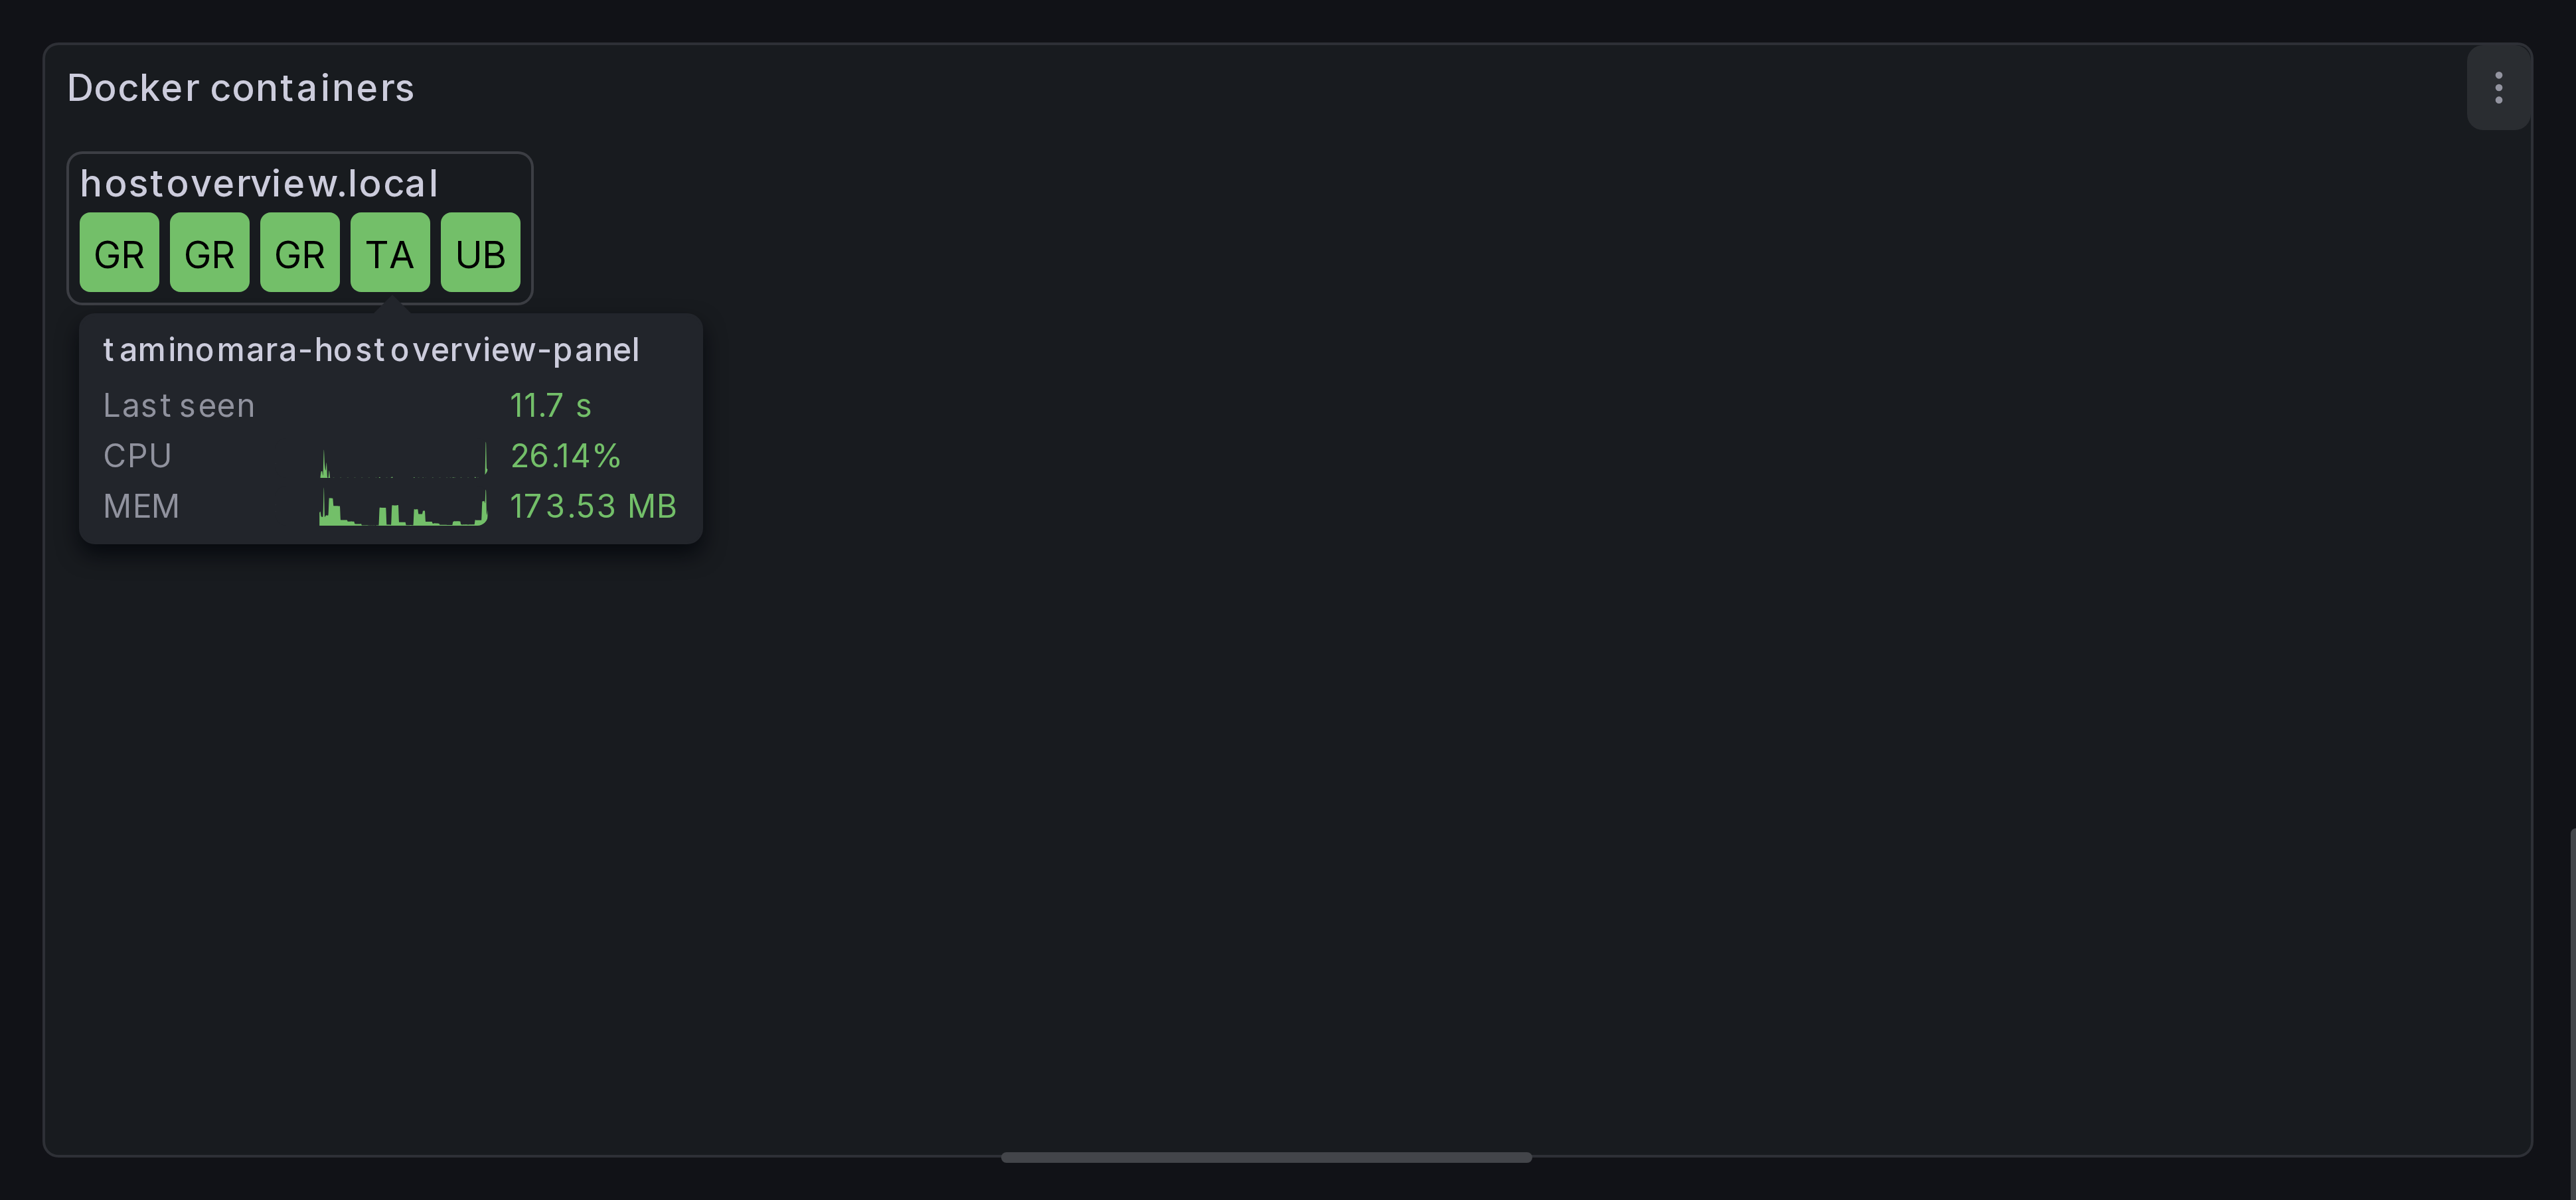
Result
You should now see additional data in all container tooltips.